Fremont: Fire Incidents, Nebraska (NE)
Where are fire incidents reported in Fremont, NE
Something went wrong! Please refresh the page.
| Fire incidents reported | |
|---|---|
| Sreet name | Count |
| BROAD ST | 132 |
| 23RD ST | 104 |
| MAIN ST | 76 |
| MILITARY AVE | 62 |
| 23RD AVE | 48 |
| BELL ST | 46 |
| 10TH ST | 34 |
| 5TH ST | 34 |
| 6TH ST | 32 |
| PIERCE ST | 30 |
| CLARKSON ST | 28 |
| LINCOLN AVE | 28 |
| PLATTE AVE | 28 |
| 4TH ST | 26 |
| I ST | 26 |
| UNION ST | 26 |
| 23 ST | 24 |
| H ST | 24 |
| NYE AVE | 24 |
| D ST | 22 |
| RIDGELAND RD | 22 |
| 11TH ST | 20 |
| 30 HWY | 20 |
| C ST | 20 |
| 1ST ST | 18 |
| YAGER RD | 18 |
| 16TH ST | 16 |
| 2ND ST | 16 |
| 8TH ST | 16 |
| MILITARY | 16 |
| Other | 137 |
2002 - 2018 National Fire Incident Reporting System (NFIRS) incidents
- Incident types reported to NFIRS in Fremont, NE
- 7,21173.6%Rescue & EMS
- 1,17312.0%Fire
- 4804.9%Hazardous Condition
- 3513.6%False Alarm
- 3373.4%Good Intent Call
- 2152.2%Service Call
- 160.2%Severe Weather
- 110.1%Special Incident
- Fire incident types reported to NFIRS in Fremont, NE
- 43837.3%Structure Fires
- 42336.1%Outside Fires
- 23419.9%Mobile Property/Vehicle Fires
- 786.6%Other
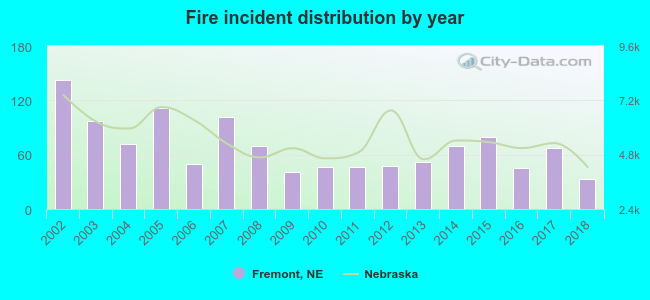 Based on the data from the years 2002 - 2018 the average number of fires per year is 69. The highest number of fires - 143 took place in 2002, and the least - 33 in 2018. The data has a decreasing trend.
The average number of yearly fire incidents per 10k residents in Fremont, NE compared to nearest cities:
(Note: Based on data for the last 3 years, including only cities with population 5,000 and above)
| Fremont: | 18.2 |
| Elkhorn: | 1.5 |
| Blair: | 15.4 |
| Gretna: | 61.7 |
| Omaha: | 35.9 |
| Ralston: | 8.3 |
| La Vista: | 3.8 |
| Papillion: | 2.7 |
| Bellevue: | 18.4 |
 The median response time based on all reported fire incidents is 5 minutes. This is lower compared to the state median value.
The median response time in Fremont, NE compared to nearest cities:
(Note: Based on data for all years, including only cities with at least 500 fire incidents)
| Fremont: | 5 minutes |
| Boys Town: | 4 minutes |
| Omaha: | 5 minutes |
| Ashland: | 8 minutes |
| Bellevue: | 6 minutes |
| Council Bluffs: | 7 minutes |
 According to the data from the years 2002 - 2018 the average number of fire-related fatalities per year is 0. The highest number of deaths - 3 took place in 2008, and the lowest - 0 in 2003. The data has a dropping trend.
 According to the data from the years 2002 - 2018 the average number of fire-related yearly casualties is 2. The highest number of reported injuries - 4 took place in 2003, and the lowest - 0 in 2009. The data has a dropping trend.
The average number of casualties per 1,000 fires is 22. This indicator was the highest - 65 in 2010, and the lowest 0 in 2009. The trend for casualties per 1,000 incidents is declining. Compared to the state value the number of injuries per 1,000 fires is much higher.
According to the data from the years 2002 - 2018 the average number of fire-related yearly casualties is 2. The highest number of reported injuries - 4 took place in 2003, and the lowest - 0 in 2009. The data has a dropping trend.
The average number of casualties per 1,000 fires is 22. This indicator was the highest - 65 in 2010, and the lowest 0 in 2009. The trend for casualties per 1,000 incidents is declining. Compared to the state value the number of injuries per 1,000 fires is much higher.Casualties per 1,000 incidents in Fremont, NE compared to nearest cities:
(Note: Based on data for all years, including only cities with at least 500 fire incidents)
| Fremont: | 24.7 |
| Boys Town: | 0.0 |
| Omaha: | 9.0 |
| Ashland: | 0.0 |
| Bellevue: | 55.9 |
| Council Bluffs: | 8.9 |
 33.1% incidents where reported in the morning and 66.9% in the evening. The most fires (16.5%) took place on Saturday, and the least (12.5%) on Wednesday.
 Based on the 1,173 incident reports from years 2002 - 2018 most fires (11.1%) took place during July, and the least (6.0%) in September.
 Out of all 9,799 cases reported during the years 2002 - 2018, the most belonged to the categories: Rescue & EMS (73.6%), Fire (12.0%), and Hazardous Condition (4.9%).
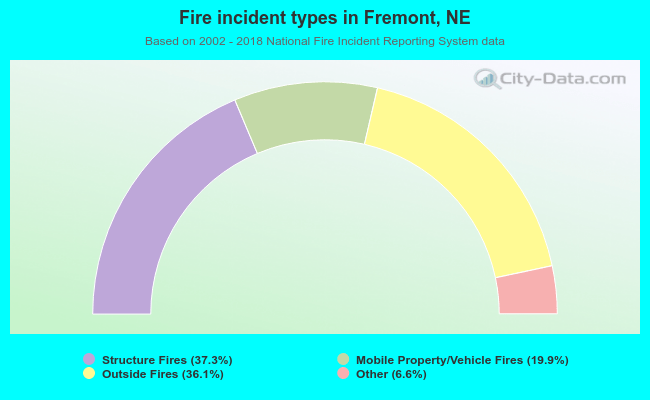 When looking into fire subcategories, the most incidents belonged to: Structure Fires (37.3%), and Outside Fires (36.1%).