Fredericksburg: Fire Incidents, Virginia (VA)
Where are fire incidents reported in Fredericksburg, VA
Something went wrong! Please refresh the page.
| Fire incidents reported | |
|---|---|
| Sreet name | Count |
| PLANK RD | 472 |
| JEFFERSON DAVIS | 364 |
| CARL D SILVER PKY | 278 |
| JEFFERSON DAVIS HWY | 244 |
| PRINCESS ANNE ST | 132 |
| SOUTHPOINT | 126 |
| WARRENTON RD | 114 |
| CAROLINE ST | 110 |
| I-95 | 92 |
| LAFAYETTE BLVD | 92 |
| FALL HILL AVE | 74 |
| COWAN BLVD | 70 |
| HARRISON RD | 70 |
| CARL D SILVER PKWY | 68 |
| SPOTSYLVANIA | 64 |
| WILLIAM ST | 60 |
| COURTHOUSE RD | 58 |
| COLLEGE AVE | 52 |
| CARL D SILVER | 46 |
| KINGS HWY | 46 |
| STAFFORD | 46 |
| I 95 | 42 |
| LAFAYETTE BLD | 42 |
| MASSAPONAX CHURCH RD | 42 |
| CHARLES ST | 40 |
| CAMBRIDGE ST | 38 |
| DIXON ST | 36 |
| GORDON RD | 36 |
| I95N | 36 |
| CENTRAL PARK BLD | 34 |
| Other | 1,353 |
2002 - 2018 National Fire Incident Reporting System (NFIRS) incidents
- Incident types reported to NFIRS in Fredericksburg, VA
- 49,09161.0%Rescue & EMS
- 9,89312.3%Hazardous Condition
- 6,5728.2%Good Intent Call
- 5,7827.2%Service Call
- 4,3775.4%Fire
- 4,3275.4%False Alarm
- 2390.3%Special Incident
- 2060.3%Severe Weather
- Fire incident types reported to NFIRS in Fredericksburg, VA
- 1,95044.6%Outside Fires
- 1,50934.5%Structure Fires
- 75417.2%Mobile Property/Vehicle Fires
- 1643.7%Other
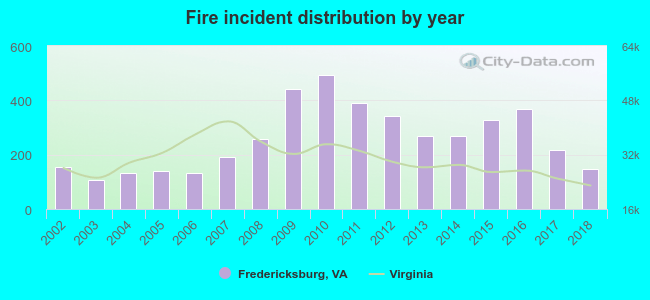 According to the data from the years 2002 - 2018 the average number of fires per year is 257. The highest number of reported fire incidents - 494 took place in 2010, and the least - 105 in 2003. The data has a declining trend.
The average number of yearly fire incidents per 10k residents in Fredericksburg, VA compared to nearest cities:
(Note: Based on data for the last 3 years, including only cities with population 5,000 and above)
| Fredericksburg: | 86.3 |
| Triangle: | 28.1 |
| Dumfries: | 140.0 |
| Dale City: | 0.3 |
| Lorton: | 44.4 |
| Culpeper: | 77.0 |
| Manassas: | 101.6 |
| Manassas Park: | 17.4 |
| Fort Belvoir: | 8.5 |
 The median response time based on all reported fire incidents is 6 minutes. This is similar to the state median value.
The median response time in Fredericksburg, VA compared to nearest cities:
(Note: Based on data for all years, including only cities with at least 500 fire incidents)
| Fredericksburg: | 6 minutes |
| King George: | 10 minutes |
| Bealeton: | 9 minutes |
| Woodbridge: | 5 minutes |
| Indian Head: | 6 minutes |
| Colonial Beach: | 10 minutes |
| Lorton: | 6 minutes |
| Bryans Road: | 6 minutes |
| Culpeper: | 13 minutes |
 Based on the reports from the years 2002 - 2018 the average number of fire-related yearly deaths is 1. The highest number of reported deaths - 2 took place in 2010, and the lowest - 0 in 2003. The data has a rising trend.
The average number of fatalities per 1,000 fire incidents is 2. This indicator was the highest - 14 in 2018, and the lowest 0 in 2003. The trend for fatalities per 1,000 fire incidents is growing. Compared to the Virginia value the number of fatalities per 1,000 incidents is similar.
Based on the reports from the years 2002 - 2018 the average number of fire-related yearly deaths is 1. The highest number of reported deaths - 2 took place in 2010, and the lowest - 0 in 2003. The data has a rising trend.
The average number of fatalities per 1,000 fire incidents is 2. This indicator was the highest - 14 in 2018, and the lowest 0 in 2003. The trend for fatalities per 1,000 fire incidents is growing. Compared to the Virginia value the number of fatalities per 1,000 incidents is similar.
 According to the data from the years 2002 - 2018 the average number of fire-related casualties per year is 3. The highest number of reported casualties - 8 took place in 2011, and the lowest - 0 in 2004. The data has a constant trend.
The average number of casualties per 1,000 fires is 12. This indicator was the highest - 22 in 2014, and the lowest 0 in 2004. The trend for injuries per 1,000 fires is increasing. Compared to the state value the number of injuries per 1,000 fires is about the same.
According to the data from the years 2002 - 2018 the average number of fire-related casualties per year is 3. The highest number of reported casualties - 8 took place in 2011, and the lowest - 0 in 2004. The data has a constant trend.
The average number of casualties per 1,000 fires is 12. This indicator was the highest - 22 in 2014, and the lowest 0 in 2004. The trend for injuries per 1,000 fires is increasing. Compared to the state value the number of injuries per 1,000 fires is about the same.Casualties per 1,000 incidents in Fredericksburg, VA compared to nearest cities:
(Note: Based on data for all years, including only cities with at least 500 fire incidents)
| Fredericksburg: | 13.5 |
| King George: | 23.0 |
| Bealeton: | 0.0 |
| Woodbridge: | 0.0 |
| Indian Head: | 0.6 |
| Colonial Beach: | 0.0 |
| Lorton: | 0.0 |
| Bryans Road: | 0.7 |
| Culpeper: | 0.0 |
 29.7% incidents where reported in the morning and 70.3% in the evening. The most fires (16.3%) took place on Monday, and the least (12.9%) on Tuesday.
 According to the 4,377 incident reports from years 2002 - 2018 most fires (11.7%) took place during April, and the least (6.1%) in December.
 Out of all 80,538 cases reported during the years 2002 - 2018, the most belonged to the categories: Rescue & EMS (61.0%), Hazardous Condition (12.3%), and Good Intent Call (8.2%).
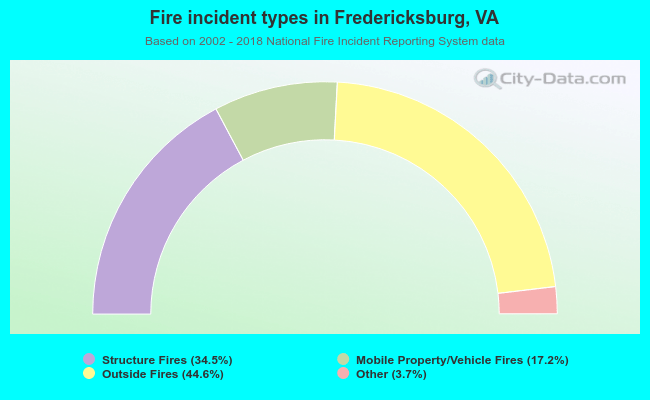 When looking into fire subcategories, the most reports belonged to: Outside Fires (44.6%), and Structure Fires (34.5%).