Fitzgerald: Fire Incidents, Georgia (GA)
Where are fire incidents reported in Fitzgerald, GA
Something went wrong! Please refresh the page.
| Fire incidents reported | |
|---|---|
| Sreet name | Count |
| GRANT ST | 48 |
| PERRY HOUSE RD | 38 |
| BENJAMIN HILL DR | 32 |
| MERRIMAC DR | 32 |
| OCONEE ST | 30 |
| PINE ST | 30 |
| BOWENS MILL HWY | 26 |
| FRANK RD | 22 |
| RIP WILEY RD | 22 |
| ROANOKE DR | 22 |
| EVERGREEN RD | 20 |
| LEMON ST | 20 |
| SUWANNEE ST | 20 |
| ALTAMAHA ST | 18 |
| LEE ST | 18 |
| MAIN ST | 18 |
| OCILLA HWY | 18 |
| OHOOPEE ST | 18 |
| IRWINVILLE HWY | 16 |
| PALM ST | 16 |
| 325 SOUTH GRANT | 14 |
| CENTRAL AVE | 14 |
| JACKSONVILLE HWY | 14 |
| MAGNOLIA ST | 14 |
| OCILLA HIGHWAY129 SOUTH HWY | 14 |
| PEACHTREE RD | 14 |
| MONITOR DR | 12 |
| WASHINGTON AVE | 12 |
| CYPRESS ST | 10 |
| EL HARRIS RD | 10 |
| Other | 446 |
2004 - 2018 National Fire Incident Reporting System (NFIRS) incidents
- Incident types reported to NFIRS in Fitzgerald, GA
- 1,05845.7%Fire
- 60726.2%Hazardous Condition
- 2279.8%False Alarm
- 1817.8%Good Intent Call
- 1556.7%Service Call
- 713.1%Rescue & EMS
- 90.4%Special Incident
- 40.2%Overpressure Rupture
- 40.2%Severe Weather
- Fire incident types reported to NFIRS in Fitzgerald, GA
- 46744.1%Outside Fires
- 41839.5%Structure Fires
- 15614.7%Mobile Property/Vehicle Fires
- 171.6%Other
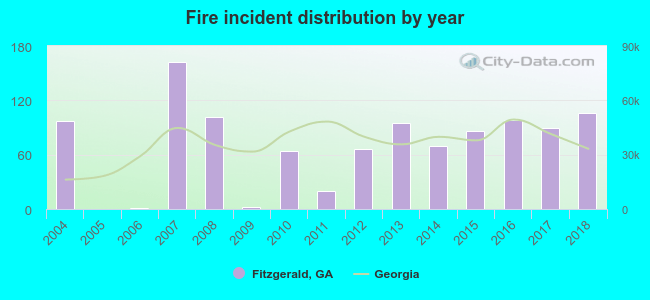 Based on the data from the years 2004 - 2018 the average number of fires per year is 71. The highest number of fire incidents - 162 took place in 2007, and the least - 0 in 2005. The data has a growing trend.
The average number of yearly fire incidents per 10k residents in Fitzgerald, GA compared to nearest cities:
(Note: Based on data for the last 3 years, including only cities with population 5,000 and above)
| Fitzgerald: | 108.1 |
| Tifton: | 107.4 |
| Douglas: | 164.0 |
| McRae: | 11.2 |
| Eastman: | 244.5 |
| Cordele: | 179.8 |
| Sylvester: | 249.8 |
| Adel: | 165.4 |
| Hawkinsville: | 147.1 |
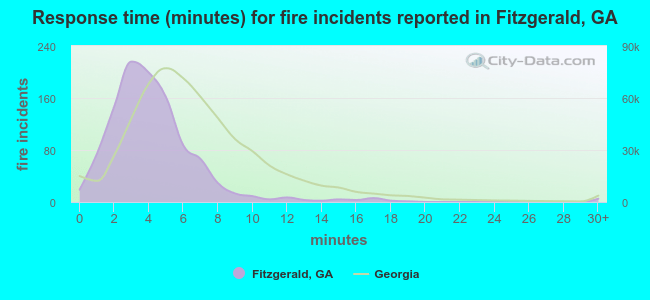 The median response time based on all reported fire incidents is 4 minutes. This is lower compared to the state median value.
The median response time in Fitzgerald, GA compared to nearest cities:
(Note: Based on data for all years, including only cities with at least 500 fire incidents)
| Fitzgerald: | 4 minutes |
| Tifton: | 6 minutes |
| Ashburn: | 4 minutes |
| Douglas: | 6 minutes |
| McRae: | 6 minutes |
| Eastman: | 6 minutes |
| Cordele: | 5 minutes |
| Nashville: | 6 minutes |
| Sylvester: | 8 minutes |
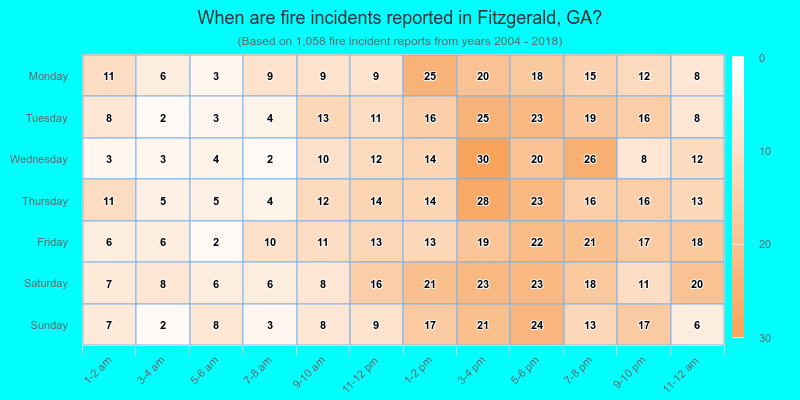
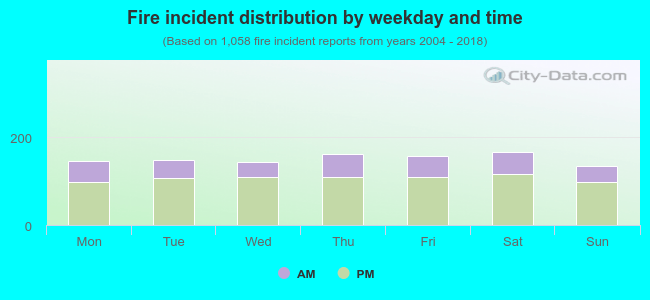 29.2% incidents where reported in the morning and 70.8% in the evening. The most fires (15.8%) took place on Saturday, and the least (12.8%) on Sunday.
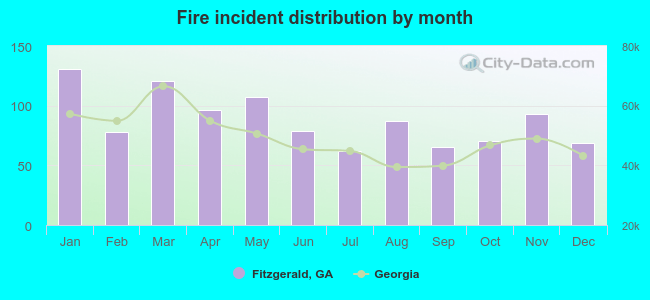 According to the 1,058 incident reports from years 2004 - 2018 most fires (12.4%) took place during January, and the least (5.9%) in July.
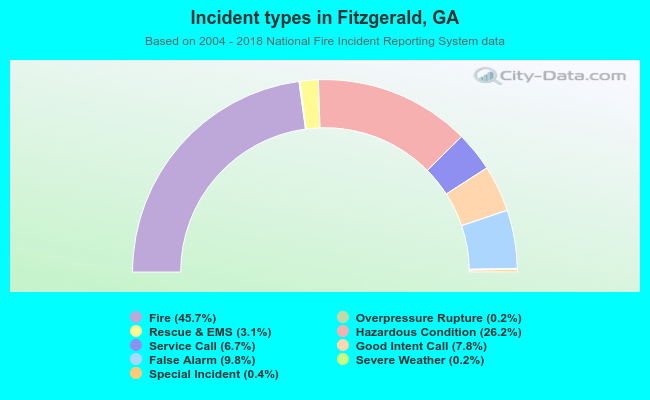 Out of all 2,316 cases reported during the years 2004 - 2018, the most belonged to the categories: Fire (45.7%), Hazardous Condition (26.2%), and False Alarm (9.8%).
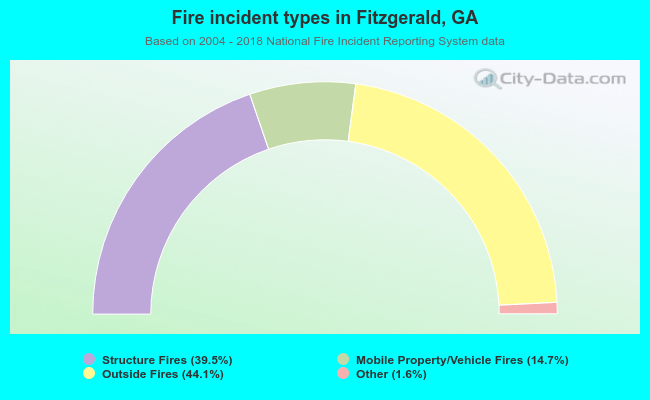 When looking into fire subcategories, the most reports belonged to: Outside Fires (44.1%), and Structure Fires (39.5%).