| Fire incidents reported |
|---|
| Sreet name | Count |
|---|
| MAIN ST | 52 | | WINTERSTOWN RD | 32 | | TRINITY RD | 28 | | MAIN EXTENDED ST | 20 | | RIPPLING RUN RD | 18 | | CHURCH RD | 14 | | LAUREL RD | 14 | | MAIN | 14 | | CHARLES ST | 12 | | CROSS ROADS AVE | 12 | | DULL RD | 12 | | FURNACE RD | 12 | | ROUTE 24 RT | 12 | | HIGH POINT RD | 10 | | HILL ST | 10 | | MAIN ST. EXTD. | 10 | | MEAD HILL RD | 10 | | MILLERS SCHOOL RD | 10 | | MOUNT OLIVET RD | 10 | | SWAMP RD | 10 | | BROWNTON RD | 8 | | GUINSTON RD | 8 | | HIGH ST | 8 | | MAIN STS | 8 | | OLD BRIDGEVILLE RD | 8 |
| | | Fire incidents reported |
|---|
| Sreet name | Count |
|---|
| PARKVIEW DR | 8 | | SEITZ AVE | 8 | | APPLE ST | 6 | | BOSLEY RD | 6 | | BROADWAY | 6 | | CANNING HOUSE RD | 6 | | COLD STREAM TR | 6 | | CROSSROAD AVE | 6 | | EVERGREEN RD | 6 | | GLESSICK SCHOOL RD | 6 | | GRIM HOLLOW RD | 6 | | HOLLOW RD | 6 | | LEBANON CHURCH RD | 6 | | LINE RD | 6 | | MAIN ST. | 6 | | OAKBROOK DR | 6 | | SCOUT CAMP RD | 6 | | SECHRIST FLAT RD | 6 | | SHAWS SCHOOL RD | 6 | | SYCAMORE LA | 6 | | ANDERSON RD | 4 | | ARBOR DR | 4 | | BLUE BALL RD | 4 | | BLYMIRE HOLLOW RD | 4 | | |
|
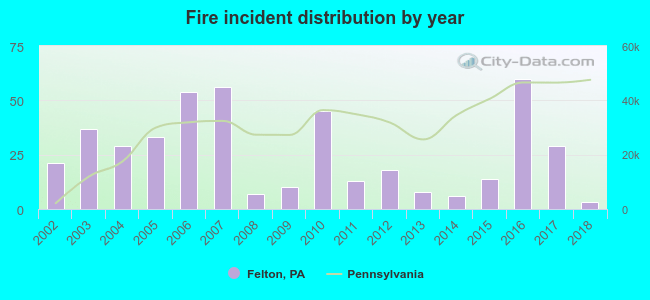 Based on the data from the years 2002 - 2018 the average number of fire incidents per year is 26. The highest number of reported fire incidents - 60 took place in 2016, and the least - 3 in 2018. The data has a declining trend.
 29.8% incidents where reported in the morning and 70.2% in the evening. The most fires (22.8%) took place on Sunday, and the least (10.2%) on Thursday.
 Based on the 443 reports from years 2002 - 2018 most fires (15.3%) took place during April, and the least (3.6%) in September.
 Out of all 1,222 cases reported during the years 2002 - 2018, the most belonged to the categories: Fire (36.3%), Overpressure Rupture (19.8%), and Hazardous Condition (14.5%).
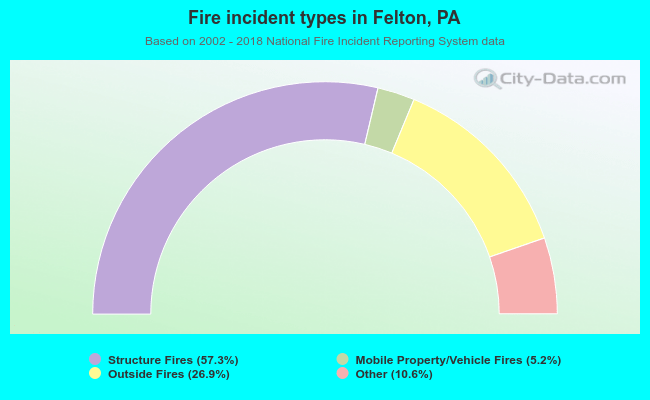 When looking into fire subcategories, the most reports belonged to: Structure Fires (57.3%), and Outside Fires (26.9%).