Fargo: Fire Incidents, North Dakota (ND)
Where are fire incidents reported in Fargo, ND
Something went wrong! Please refresh the page.
| Fire incidents reported | |
|---|---|
| Sreet name | Count |
| UNIVERSITY DR | 278 |
| 13 AVE | 222 |
| MAIN AVE | 214 |
| BROADWAY | 180 |
| 7 AVE | 166 |
| 1 AVE | 148 |
| 42 ST | 122 |
| 15 AVE | 120 |
| 9 AVE | 116 |
| 11 ST | 106 |
| 3 AVE | 104 |
| 40 ST | 104 |
| 12 AVE | 102 |
| 45 ST | 98 |
| 19 AVE | 96 |
| 10 ST | 94 |
| 14 ST | 94 |
| 25 ST | 94 |
| 6 AVE | 90 |
| 7 ST | 90 |
| 2 ST | 88 |
| 17 AVE | 82 |
| 18 ST | 80 |
| 4 AVE | 80 |
| 4 ST | 80 |
| 8 ST | 78 |
| 10 AVE | 76 |
| 15 ST | 76 |
| 16 AVE | 76 |
| 32 AVE | 76 |
| Other | 335 |
2002 - 2018 National Fire Incident Reporting System (NFIRS) incidents
- Incident types reported to NFIRS in Fargo, ND
- 28,42852.4%Rescue & EMS
- 7,30713.5%False Alarm
- 5,47110.1%Hazardous Condition
- 4,4658.2%Good Intent Call
- 4,4588.2%Service Call
- 3,7656.9%Fire
- 2630.5%Special Incident
- 1090.2%Overpressure Rupture
- Fire incident types reported to NFIRS in Fargo, ND
- 1,72545.8%Structure Fires
- 1,16731.0%Outside Fires
- 82822.0%Mobile Property/Vehicle Fires
- 451.2%Other
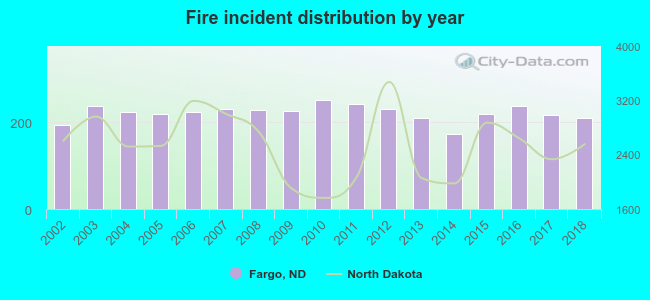 Based on the data from the years 2002 - 2018 the average number of fires per year is 221. The highest number of reported fire incidents - 250 took place in 2010, and the least - 172 in 2014. The data has a growing trend.
The average number of yearly fire incidents per 10k residents in Fargo, ND compared to nearest cities:
(Note: Based on data for the last 3 years, including only cities with population 5,000 and above)
| Fargo: | 19.1 |
| West Fargo: | 15.5 |
| Wahpeton: | 32.1 |
 The median response time based on all reported fire incidents is 5 minutes. This is lower compared to the state median value.
The median response time in Fargo, ND compared to nearest cities:
(Note: Based on data for all years, including only cities with at least 500 fire incidents)
| Fargo: | 5 minutes |
| Moorhead: | 5 minutes |
| West Fargo: | 6 minutes |
| Detroit Lakes: | 4 minutes |
 Based on the data from the years 2002 - 2018 the average number of fire-related fatalities per year is 0. The highest number of deaths - 2 took place in 2013, and the lowest - 0 in 2004. The data has a decreasing trend.
The average number of fatalities per 1,000 fire incidents is 2. This indicator was the highest - 10 in 2013, and the lowest 0 in 2004. The trend for deaths per 1,000 incidents is decreasing. Compared to the North Dakota value the number of deaths per 1,000 incidents is similar.
Based on the data from the years 2002 - 2018 the average number of fire-related fatalities per year is 0. The highest number of deaths - 2 took place in 2013, and the lowest - 0 in 2004. The data has a decreasing trend.
The average number of fatalities per 1,000 fire incidents is 2. This indicator was the highest - 10 in 2013, and the lowest 0 in 2004. The trend for deaths per 1,000 incidents is decreasing. Compared to the North Dakota value the number of deaths per 1,000 incidents is similar.Deaths per 1,000 incidents in Fargo, ND compared to nearest cities:
(Note: Based on data for all years, including only cities with at least 2,500 fire incidents)
| Fargo: | 1.9 |
 Based on the data from the years 2002 - 2018 the average number of fire-related casualties per year is 5. The highest number of injuries - 8 took place in 2004, and the lowest - 2 in 2008. The data has an increasing trend.
The average number of casualties per 1,000 fire incidents is 22. This indicator was the highest - 37 in 2015, and the lowest 9 in 2008. The trend for injuries per 1,000 fires is increasing. Compared to the state value the number of injuries per 1,000 fires is much higher.
Based on the data from the years 2002 - 2018 the average number of fire-related casualties per year is 5. The highest number of injuries - 8 took place in 2004, and the lowest - 2 in 2008. The data has an increasing trend.
The average number of casualties per 1,000 fire incidents is 22. This indicator was the highest - 37 in 2015, and the lowest 9 in 2008. The trend for injuries per 1,000 fires is increasing. Compared to the state value the number of injuries per 1,000 fires is much higher.Casualties per 1,000 incidents in Fargo, ND compared to nearest cities:
(Note: Based on data for all years, including only cities with at least 500 fire incidents)
| Fargo: | 22.3 |
| Moorhead: | 7.2 |
| West Fargo: | 1.5 |
| Detroit Lakes: | 1.1 |
 34.3% incidents where reported in the morning and 65.7% in the evening. The most fires (16.3%) took place on Saturday, and the least (13.1%) on Tuesday.
 Based on the 3,765 fires from years 2002 - 2018 most fires (11.3%) took place during May, and the least (5.6%) in February.
 Out of all 54,282 cases reported during the years 2002 - 2018, the most belonged to the categories: Rescue & EMS (52.4%), False Alarm (13.5%), and Hazardous Condition (10.1%).
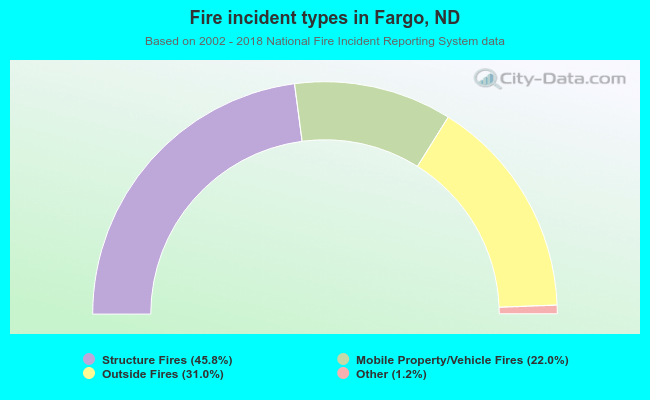 When looking into fire subcategories, the most reports belonged to: Structure Fires (45.8%), and Outside Fires (31.0%).