Fairfield: Fire Incidents, Iowa (IA)
Where are fire incidents reported in Fairfield, IA
Something went wrong! Please refresh the page.
|
| |||||||||||||||||||||||||||||||||||||||||||||||||||||||||||||||||||||||||||||||||||||||||||||||||||||||||||||
| Other | 45 | |||||||||||||||||||||||||||||||||||||||||||||||||||||||||||||||||||||||||||||||||||||||||||||||||||||||||||||
2002 - 2018 National Fire Incident Reporting System (NFIRS) incidents
- Incident types reported to NFIRS in Fairfield, IA
- 82737.8%Hazardous Condition
- 69932.0%Fire
- 28913.2%Good Intent Call
- 1486.8%Service Call
- 1054.8%Rescue & EMS
- 1034.7%False Alarm
- 80.4%Overpressure Rupture
- 80.4%Special Incident
- Fire incident types reported to NFIRS in Fairfield, IA
- 32045.8%Outside Fires
- 23834.0%Structure Fires
- 9613.7%Mobile Property/Vehicle Fires
- 456.4%Other
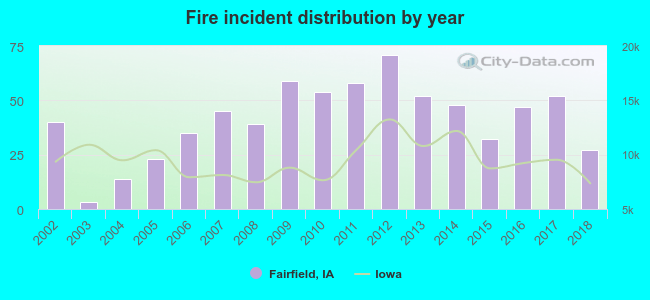 According to the data from the years 2002 - 2018 the average number of fires per year is 41. The highest number of fire incidents - 71 took place in 2012, and the least - 3 in 2003. The data has a declining trend.
The average number of yearly fire incidents per 10k residents in Fairfield, IA compared to nearest cities:
(Note: Based on data for the last 3 years, including only cities with population 5,000 and above)
| Fairfield: | 43.1 |
| Mount Pleasant: | 43.9 |
| Ottumwa: | 101.5 |
| Washington: | 43.5 |
 The median response time based on all reported fire incidents is 6 minutes. This is comparable to the Iowa median value.
The median response time in Fairfield, IA compared to nearest cities:
(Note: Based on data for all years, including only cities with at least 500 fire incidents)
| Fairfield: | 6 minutes |
| Ottumwa: | 4 minutes |
| Washington: | 6 minutes |
 25.0% incidents where reported in the morning and 75.0% in the evening. The most fires (19.2%) took place on Saturday, and the least (9.4%) on Thursday.
 According to the 699 incident reports from years 2002 - 2018 most fires (15.9%) took place during March, and the least (4.7%) in August.
 Out of all 2,187 cases reported during the years 2002 - 2018, the most belonged to the categories: Hazardous Condition (37.8%), Fire (32.0%), and Good Intent Call (13.2%).
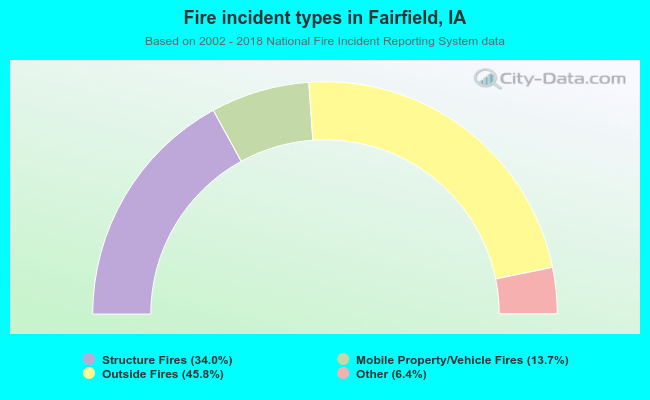 When looking into fire subcategories, the most incidents belonged to: Outside Fires (45.8%), and Structure Fires (34.0%).