Estherville: Fire Incidents, Iowa (IA)
Where are fire incidents reported in Estherville, IA
Something went wrong! Please refresh the page.
|
| |||||||||||||||||||||||||||||||||||||||||||||||||||||||||||||||||||||||||||||||||||||||||||||||||||||||||||||
2002 - 2018 National Fire Incident Reporting System (NFIRS) incidents
- Incident types reported to NFIRS in Estherville, IA
- 23252.7%Fire
- 9220.9%Good Intent Call
- 378.4%Hazardous Condition
- 306.8%Rescue & EMS
- 286.4%Service Call
- 143.2%False Alarm
- 51.1%Special Incident
- 10.2%Overpressure Rupture
- 10.2%Severe Weather
- Fire incident types reported to NFIRS in Estherville, IA
- 9139.2%Outside Fires
- 8837.9%Structure Fires
- 4117.7%Mobile Property/Vehicle Fires
- 125.2%Other
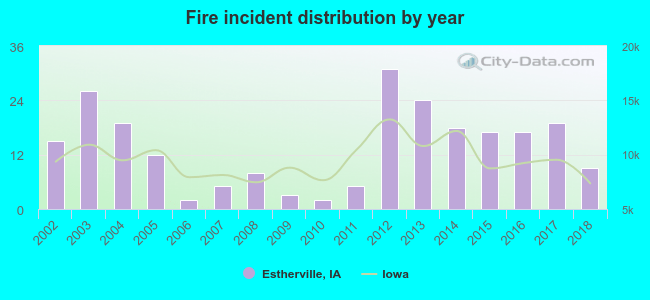 According to the data from the years 2002 - 2018 the average number of fires per year is 14. The highest number of fire incidents - 31 took place in 2012, and the least - 2 in 2006. The data has a declining trend.

 25.4% incidents where reported in the morning and 74.6% in the evening. The most fires (19.8%) took place on Monday, and the least (8.6%) on Thursday.
 Based on the 232 incident reports from years 2002 - 2018 most fires (13.4%) took place during October, and the least (4.3%) in February.
 Out of all 440 cases reported during the years 2002 - 2018, the most belonged to the categories: Fire (52.7%), Good Intent Call (20.9%), and Hazardous Condition (8.4%).
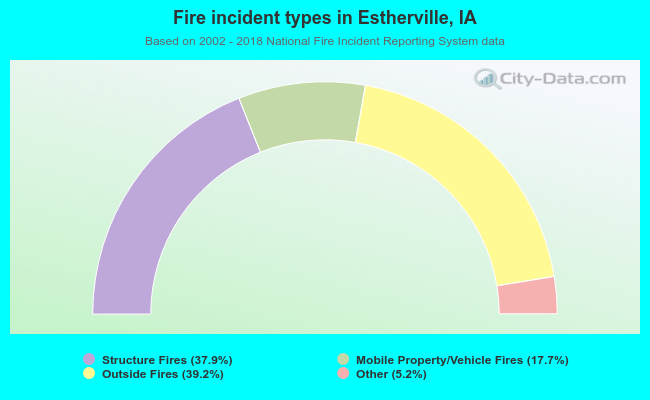 When looking into fire subcategories, the most reports belonged to: Outside Fires (39.2%), and Structure Fires (37.9%).