Erie: Fire Incidents, Pennsylvania (PA)
Where are fire incidents reported in Erie, PA
Something went wrong! Please refresh the page.
| Fire incidents reported | |
|---|---|
| Sreet name | Count |
| STATE ST | 196 |
| 12TH ST ST | 156 |
| 11TH ST ST | 136 |
| PEACH ST | 130 |
| PEACH ST | 122 |
| 6TH ST ST | 116 |
| 9TH ST ST | 116 |
| 8TH ST ST | 112 |
| 4TH ST ST | 108 |
| 21ST ST ST | 96 |
| 5TH ST ST | 96 |
| 7TH ST ST | 94 |
| 10TH ST ST | 92 |
| 26TH ST | 92 |
| 3RD ST ST | 92 |
| 16TH ST ST | 86 |
| 20TH ST ST | 84 |
| 2ND ST ST | 78 |
| 18TH ST ST | 72 |
| 25TH ST ST | 70 |
| 8TH ST | 70 |
| 24TH ST ST | 68 |
| LAKE RD | 66 |
| PEACH STREET | 60 |
| 12TH ST | 58 |
| BUFFALO RD | 58 |
| 13TH ST ST | 56 |
| 26TH ST ST | 56 |
| 38TH ST | 56 |
| 38TH ST ST | 56 |
| Other | 1,272 |
2004 - 2018 National Fire Incident Reporting System (NFIRS) incidents
- Incident types reported to NFIRS in Erie, PA
- 24,83157.1%Rescue & EMS
- 5,43812.5%False Alarm
- 4,0209.3%Fire
- 3,4818.0%Hazardous Condition
- 3,2137.4%Good Intent Call
- 1,6893.9%Service Call
- 6121.4%Special Incident
- 1090.3%Severe Weather
- 640.1%Overpressure Rupture
- Fire incident types reported to NFIRS in Erie, PA
- 1,91447.6%Structure Fires
- 1,30932.6%Outside Fires
- 40910.2%Mobile Property/Vehicle Fires
- 3889.7%Other
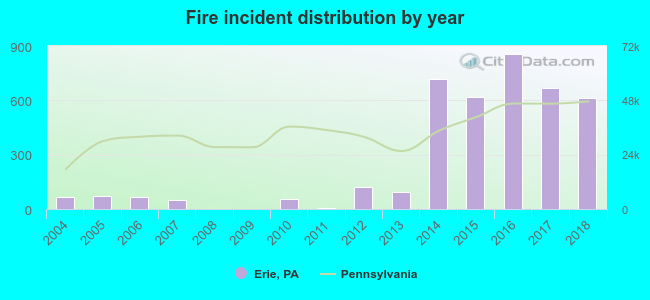 According to the data from the years 2004 - 2018 the average number of fires per year is 267. The highest number of fires - 855 took place in 2016, and the least - 0 in 2008. The data has a growing trend.
The average number of yearly fire incidents per 10k residents in Erie, PA compared to nearest cities:
(Note: Based on data for the last 3 years, including only cities with population 5,000 and above)
| Erie: | 71.6 |
| Edinboro: | 35.7 |
| Corry: | 38.7 |
| Meadville: | 117.1 |
| Titusville: | 66.4 |
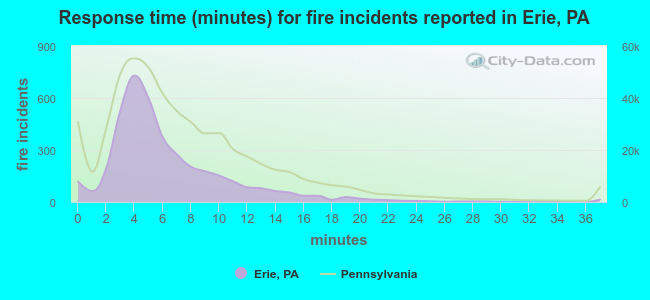 The median response time based on all reported fire incidents is 5 minutes. This is lower than the Pennsylvania median value.
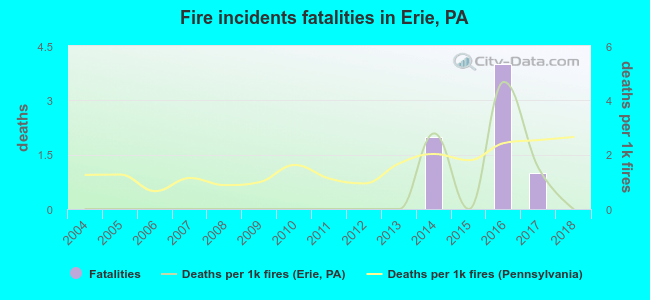 According to the reports from the years 2004 - 2018 the average number of fire-related yearly deaths is 0. The highest number of reported deaths - 4 took place in 2016, and the lowest - 0 in 2004. The data has a constant trend.
The average number of fatalities per 1,000 fire incidents is 1. This indicator was the highest - 5 in 2016, and the lowest 0 in 2004. The trend for fatalities per 1,000 fire incidents is constant. Compared to the Pennsylvania value the number of fatalities per 1,000 fires is about the same.
According to the reports from the years 2004 - 2018 the average number of fire-related yearly deaths is 0. The highest number of reported deaths - 4 took place in 2016, and the lowest - 0 in 2004. The data has a constant trend.
The average number of fatalities per 1,000 fire incidents is 1. This indicator was the highest - 5 in 2016, and the lowest 0 in 2004. The trend for fatalities per 1,000 fire incidents is constant. Compared to the Pennsylvania value the number of fatalities per 1,000 fires is about the same.Deaths per 1,000 incidents in Erie, PA compared to nearest cities:
(Note: Based on data for all years, including only cities with at least 2,500 fire incidents)
| Erie: | 1.7 |
| Ashtabula: | 2.7 |
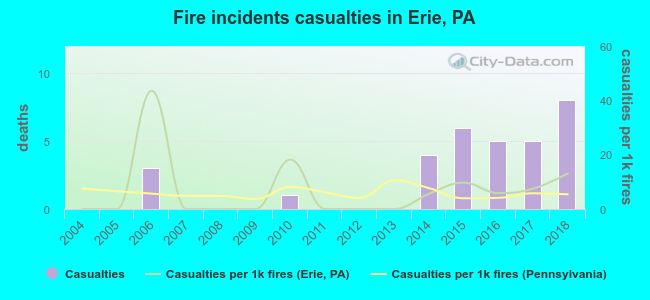 According to the data from the years 2004 - 2018 the average number of fire-related yearly casualties is 2. The highest number of reported casualties - 8 took place in 2018, and the lowest - 0 in 2004. The data has a rising trend.
The average number of injuries per 1,000 fire incidents is 7. This indicator was the highest - 43 in 2006, and the lowest 0 in 2004. The trend for injuries per 1,000 fires is increasing. Compared to the state value the number of casualties per 1,000 fire incidents is higher.
According to the data from the years 2004 - 2018 the average number of fire-related yearly casualties is 2. The highest number of reported casualties - 8 took place in 2018, and the lowest - 0 in 2004. The data has a rising trend.
The average number of injuries per 1,000 fire incidents is 7. This indicator was the highest - 43 in 2006, and the lowest 0 in 2004. The trend for injuries per 1,000 fires is increasing. Compared to the state value the number of casualties per 1,000 fire incidents is higher.
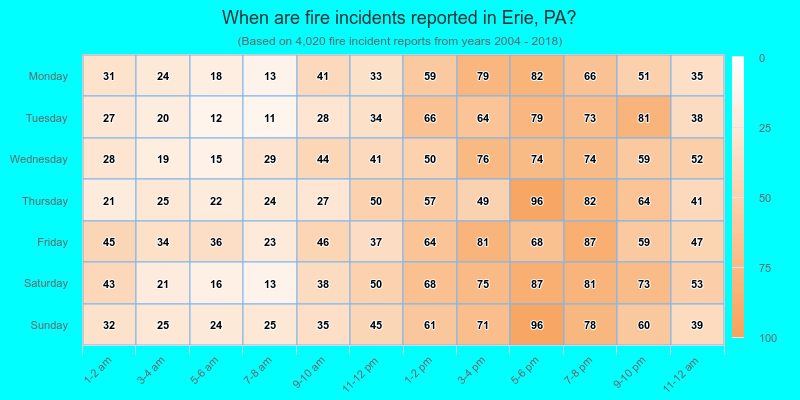
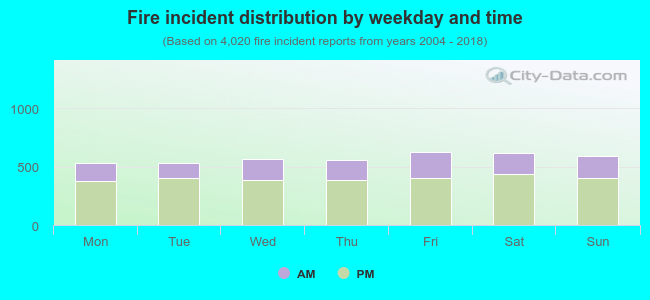 30.5% incidents where reported in the morning and 69.5% in the evening. The most fires (15.6%) took place on Friday, and the least (13.2%) on Monday.
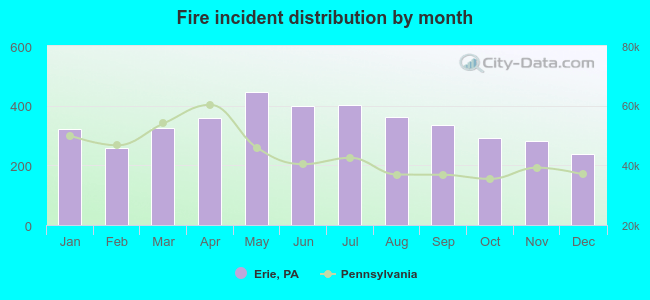 According to the 4,020 reports from years 2004 - 2018 most fires (11.1%) took place during May, and the least (5.9%) in December.
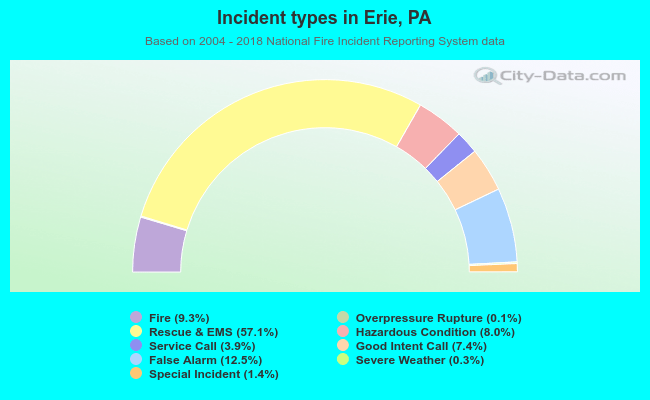 Out of all 43,457 cases reported during the years 2004 - 2018, the most belonged to the categories: Rescue & EMS (57.1%), False Alarm (12.5%), and Fire (9.3%).
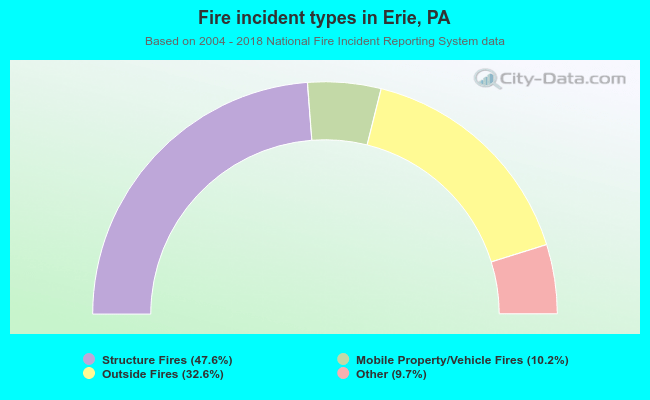 When looking into fire subcategories, the most incidents belonged to: Structure Fires (47.6%), and Outside Fires (32.6%).