Elmwood Park: Fire Incidents, Illinois (IL)
Where are fire incidents reported in Elmwood Park, IL
Something went wrong! Please refresh the page.
| Fire incidents reported | |
|---|---|
| Sreet name | Count |
| NORTH AVE | 678 |
| HARLEM AVE | 188 |
| GRAND AVE | 180 |
| 75TH AVE | 130 |
| 76TH AVE | 124 |
| 72ND CT | 120 |
| 74TH CT | 110 |
| 74TH AVE | 104 |
| 73RD CT | 102 |
| 75TH CT | 90 |
| 76TH CT | 90 |
| 73RD AVE | 76 |
| 77TH CT | 76 |
| FULLERTON AVE | 72 |
| 77TH AVE | 68 |
| NORTH | 60 |
| 78TH AVE | 50 |
| WELLINGTON AVE | 44 |
| SUNSET DR | 40 |
| WESTWOOD DR | 38 |
| 79TH AVE | 36 |
| BELMONT AVE | 36 |
| CONTI PKY | 34 |
| ALTGELD | 28 |
| ALTGELD ST | 28 |
| DIVERSEY AVE | 26 |
| ALTGELD AVE | 24 |
| 75TH AVE | 22 |
| 79TH CT | 22 |
| HARLEM | 22 |
2002 - 2018 National Fire Incident Reporting System (NFIRS) incidents
- Incident types reported to NFIRS in Elmwood Park, IL
- 10,10154.4%Rescue & EMS
- 1,93810.4%False Alarm
- 1,89010.2%Service Call
- 1,7199.3%Good Intent Call
- 1,7049.2%Fire
- 1,1486.2%Hazardous Condition
- 440.2%Special Incident
- Fire incident types reported to NFIRS in Elmwood Park, IL
- 1,17569.0%Structure Fires
- 28316.6%Outside Fires
- 1448.5%Mobile Property/Vehicle Fires
- 1026.0%Other
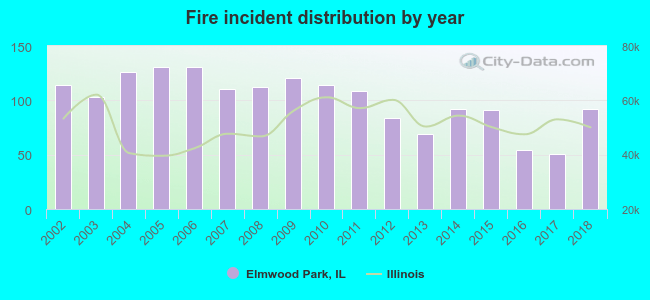 According to the data from the years 2002 - 2018 the average number of fires per year is 100. The highest number of fire incidents - 131 took place in 2005, and the least - 51 in 2017. The data has a dropping trend.
The average number of yearly fire incidents per 10k residents in Elmwood Park, IL compared to nearest cities:
(Note: Based on data for the last 3 years, including only cities with population 5,000 and above)
| Elmwood Park: | 26.3 |
| River Grove: | 29.2 |
| River Forest: | 50.6 |
| Melrose Park: | 35.1 |
| Oak Park: | 26.3 |
| Norridge: | 11.8 |
| Harwood Heights: | 22.5 |
| Franklin Park: | 39.5 |
| Maywood: | 58.8 |
 The median response time based on all reported fire incidents is 5 minutes. This is comparable to the state median value.
The median response time in Elmwood Park, IL compared to nearest cities:
(Note: Based on data for all years, including only cities with at least 500 fire incidents)
| Elmwood Park: | 5 minutes |
| River Grove: | 4 minutes |
| River Forest: | 6 minutes |
| Melrose Park: | 4 minutes |
| Oak Park: | 5 minutes |
| Franklin Park: | 4 minutes |
| Maywood: | 3 minutes |
| Forest Park: | 5 minutes |
| Schiller Park: | 4 minutes |
 According to the data from the years 2002 - 2018 the average number of fire-related casualties per year is 0. The highest number of reported injuries - 3 took place in 2018, and the lowest - 0 in 2002. The data has a rising trend.
The average number of casualties per 1,000 fires is 4. This indicator was the highest - 33 in 2018, and the lowest 0 in 2002. The trend for casualties per 1,000 fires is increasing. Compared to the Illinois value the number of injuries per 1,000 fire incidents is much lower.
According to the data from the years 2002 - 2018 the average number of fire-related casualties per year is 0. The highest number of reported injuries - 3 took place in 2018, and the lowest - 0 in 2002. The data has a rising trend.
The average number of casualties per 1,000 fires is 4. This indicator was the highest - 33 in 2018, and the lowest 0 in 2002. The trend for casualties per 1,000 fires is increasing. Compared to the Illinois value the number of injuries per 1,000 fire incidents is much lower.Casualties per 1,000 incidents in Elmwood Park, IL compared to nearest cities:
(Note: Based on data for all years, including only cities with at least 500 fire incidents)
| Elmwood Park: | 3.5 |
| River Grove: | 3.1 |
| River Forest: | 5.5 |
| Melrose Park: | 12.3 |
| Oak Park: | 11.2 |
| Franklin Park: | 15.4 |
| Maywood: | 6.1 |
| Forest Park: | 8.3 |
| Schiller Park: | 8.6 |
 31.1% incidents where reported in the morning and 68.9% in the evening. The most fires (18.4%) took place on Sunday, and the least (11.2%) on Wednesday.
 Based on the 1,704 fire incidents from years 2002 - 2018 most fires (10.0%) took place during November, and the least (5.9%) in August.
 Out of all 18,575 cases reported during the years 2002 - 2018, the most belonged to the categories: Rescue & EMS (54.4%), False Alarm (10.4%), and Service Call (10.2%).
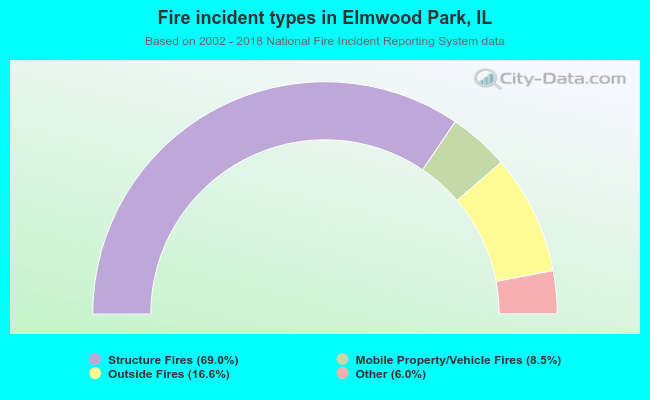 When looking into fire subcategories, the most reports belonged to: Structure Fires (69.0%), and Outside Fires (16.6%).