El Rio: Fire Incidents, California (CA)
Where are fire incidents reported in El Rio, CA
Something went wrong! Please refresh the page.
|
| |||||||||||||||||||||||||||||||||||||||||||||||||||||||||||||||||||||||||||||||||||||||||||||||||||||||||||||
2006 - 2018 National Fire Incident Reporting System (NFIRS) incidents
- Incident types reported to NFIRS in El Rio, CA
- 1,40165.5%Rescue & EMS
- 23010.8%Good Intent Call
- 21910.2%Fire
- 1316.1%Service Call
- 954.4%Hazardous Condition
- 552.6%False Alarm
- 40.2%Special Incident
- Fire incident types reported to NFIRS in El Rio, CA
- 9844.7%Outside Fires
- 5525.1%Structure Fires
- 3415.5%Mobile Property/Vehicle Fires
- 3214.6%Other
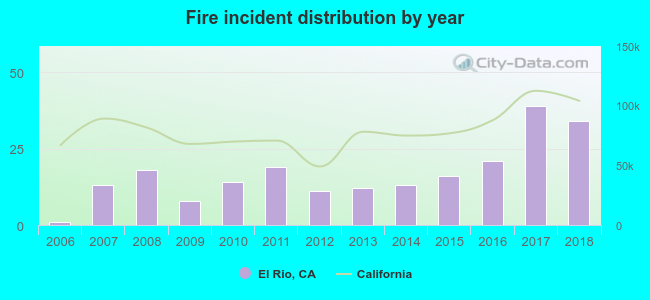 According to the data from the years 2006 - 2018 the average number of fires per year is 17. The highest number of reported fire incidents - 39 took place in 2017, and the least - 1 in 2006. The data has a rising trend.
The average number of yearly fire incidents per 10k residents in El Rio, CA compared to nearest cities:
(Note: Based on data for the last 3 years, including only cities with population 5,000 and above)
| El Rio: | 43.5 |
| Oxnard: | 24.6 |
| Ventura: | 37.4 |
| Port Hueneme: | 26.3 |
| Camarillo: | 17.4 |
| Santa Paula: | 24.2 |
| Mira Monte: | 4.4 |
| Ojai: | 47.6 |
| Moorpark: | 13.3 |

 31.1% incidents where reported in the morning and 68.9% in the evening. The most fires (17.4%) took place on Tuesday, and the least (11.9%) on Friday.
 Based on the 219 reports from years 2006 - 2018 most fires (11.4%) took place during August, and the least (5.5%) in November.
 Out of all 2,138 cases reported during the years 2006 - 2018, the most belonged to the categories: Rescue & EMS (65.5%), Good Intent Call (10.8%), and Fire (10.2%).
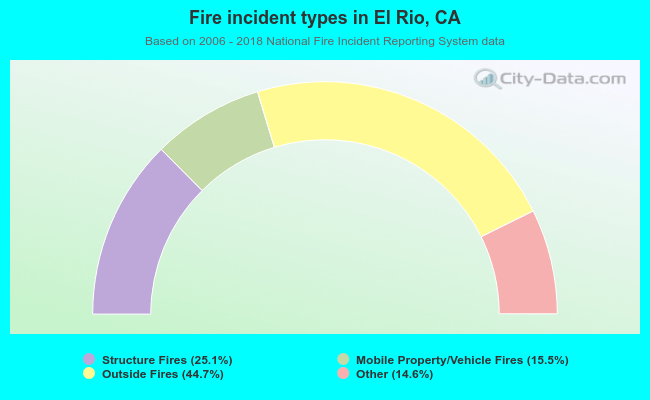 When looking into fire subcategories, the most incidents belonged to: Outside Fires (44.7%), and Structure Fires (25.1%).