El Dorado: Fire Incidents, Kansas (KS)
Where are fire incidents reported in El Dorado, KS
Something went wrong! Please refresh the page.
| Fire incidents reported | |
|---|---|
| Sreet name | Count |
| CENTRAL AVE | 208 |
| 10TH | 150 |
| 30TH | 150 |
| 40TH | 148 |
| 20TH | 134 |
| MAIN ST | 124 |
| HAVERHILL RD | 112 |
| BOYER RD | 98 |
| 50TH | 86 |
| STAR ST | 84 |
| KTA-35 | 80 |
| HWY 54 | 76 |
| PARALLEL | 76 |
| 6TH AVE | 74 |
| HAVERHILL | 74 |
| TOPEKA ST | 66 |
| BLUESTEM | 64 |
| LOCUST AVE | 64 |
| TAYLOR ST | 64 |
| TOWANDA AVE | 62 |
| HIGH ST | 60 |
| HWY 254 | 54 |
| WOODLAND ST | 54 |
| 60TH ST | 50 |
| PURITY SPRINGS | 48 |
| WASHINGTON ST | 48 |
| HWY 196 | 46 |
| HWY 77 | 44 |
| COLE CREEK RD | 42 |
| DENVER ST | 42 |
| Other | 57 |
2002 - 2018 National Fire Incident Reporting System (NFIRS) incidents
- Incident types reported to NFIRS in El Dorado, KS
- 3,22135.3%Rescue & EMS
- 2,53927.9%Fire
- 1,22213.4%Hazardous Condition
- 99510.9%Good Intent Call
- 7278.0%Service Call
- 3493.8%False Alarm
- 340.4%Severe Weather
- 170.2%Overpressure Rupture
- 100.1%Special Incident
- Fire incident types reported to NFIRS in El Dorado, KS
- 1,56661.7%Outside Fires
- 58623.1%Structure Fires
- 32212.7%Mobile Property/Vehicle Fires
- 652.6%Other
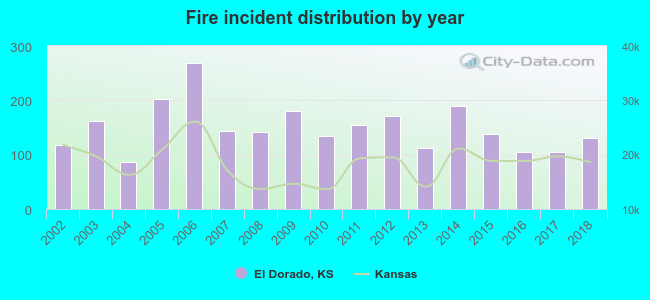 Based on the data from the years 2002 - 2018 the average number of fires per year is 149. The highest number of fires - 268 took place in 2006, and the least - 86 in 2004. The data has a rising trend.
The average number of yearly fire incidents per 10k residents in El Dorado, KS compared to nearest cities:
(Note: Based on data for the last 3 years, including only cities with population 5,000 and above)
| El Dorado: | 87.7 |
| Augusta: | 154.4 |
| Andover: | 51.4 |
| Bel Aire: | 17.4 |
| Park City: | 41.9 |
| Wichita: | 48.0 |
| Valley Center: | 119.5 |
| Derby: | 66.0 |
| Newton: | 59.3 |
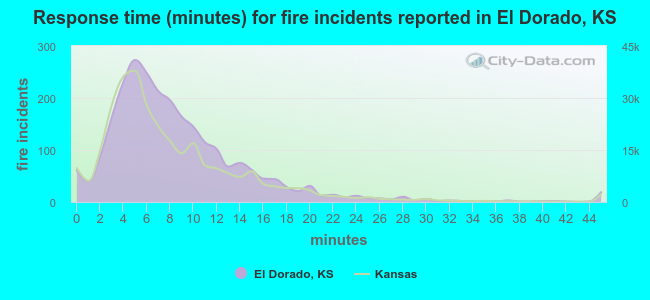 The median response time based on all reported fire incidents is 7 minutes. This is similar to the Kansas median value.
The median response time in El Dorado, KS compared to nearest cities:
(Note: Based on data for all years, including only cities with at least 500 fire incidents)
| El Dorado: | 7 minutes |
| Augusta: | 8 minutes |
| Benton: | 10 minutes |
| Andover: | 5 minutes |
| Douglass: | 10 minutes |
| Rose Hill: | 7 minutes |
| Wichita: | 4 minutes |
| Valley Center: | 8 minutes |
| Derby: | 5 minutes |
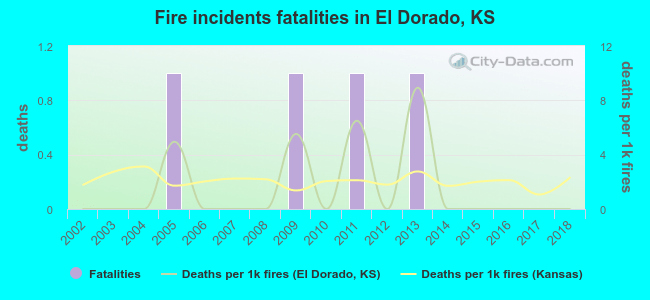 According to the reports from the years 2002 - 2018 the average number of fire-related fatalities per year is 0. The highest number of deaths - 1 took place in 2005, and the lowest - 0 in 2002. The data has a constant trend.
The average number of deaths per 1,000 fires is 2. This indicator was the highest - 9 in 2013, and the lowest 0 in 2002. The trend for deaths per 1,000 fires is constant. Compared to the state value the number of fatalities per 1,000 incidents is lower.
According to the reports from the years 2002 - 2018 the average number of fire-related fatalities per year is 0. The highest number of deaths - 1 took place in 2005, and the lowest - 0 in 2002. The data has a constant trend.
The average number of deaths per 1,000 fires is 2. This indicator was the highest - 9 in 2013, and the lowest 0 in 2002. The trend for deaths per 1,000 fires is constant. Compared to the state value the number of fatalities per 1,000 incidents is lower.Deaths per 1,000 incidents in El Dorado, KS compared to nearest cities:
(Note: Based on data for all years, including only cities with at least 2,500 fire incidents)
| El Dorado: | 1.6 |
| Wichita: | 2.6 |
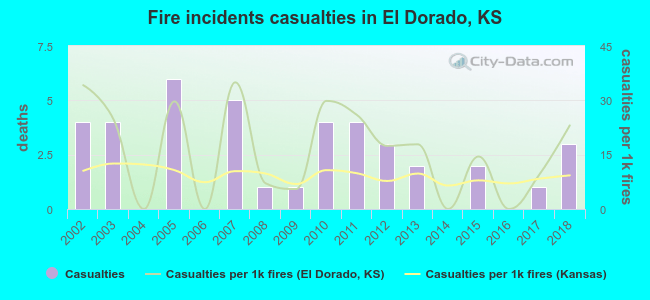 Based on the reports from the years 2002 - 2018 the average number of fire-related yearly casualties is 2. The highest number of reported injuries - 6 took place in 2005, and the lowest - 0 in 2004. The data has a declining trend.
The average number of injuries per 1,000 fire incidents is 16. This indicator was the highest - 35 in 2007, and the lowest 0 in 2004. The trend for injuries per 1,000 fire incidents is decreasing. Compared to the Kansas value the number of casualties per 1,000 fires is higher.
Based on the reports from the years 2002 - 2018 the average number of fire-related yearly casualties is 2. The highest number of reported injuries - 6 took place in 2005, and the lowest - 0 in 2004. The data has a declining trend.
The average number of injuries per 1,000 fire incidents is 16. This indicator was the highest - 35 in 2007, and the lowest 0 in 2004. The trend for injuries per 1,000 fire incidents is decreasing. Compared to the Kansas value the number of casualties per 1,000 fires is higher.
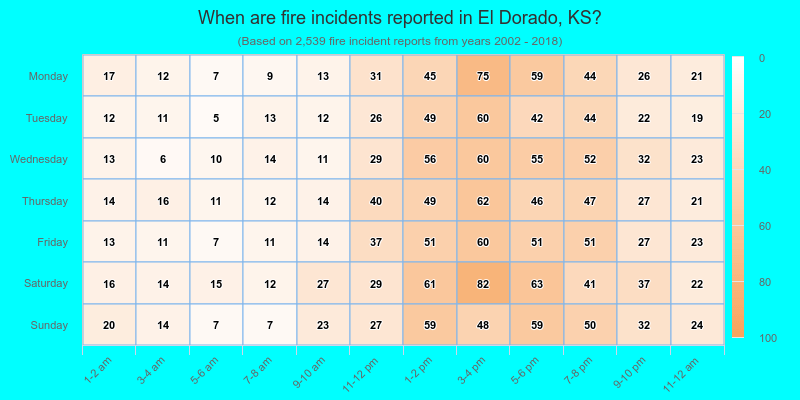
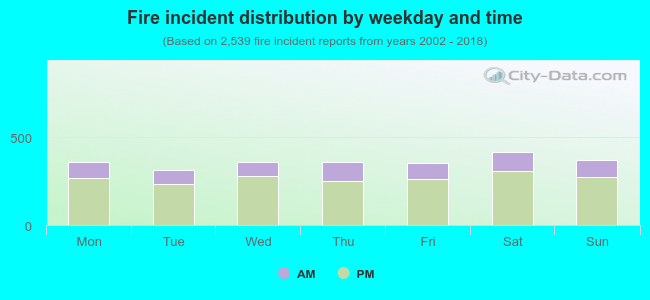 26.1% incidents where reported in the morning and 73.9% in the evening. The most fires (16.5%) took place on Saturday, and the least (12.4%) on Tuesday.
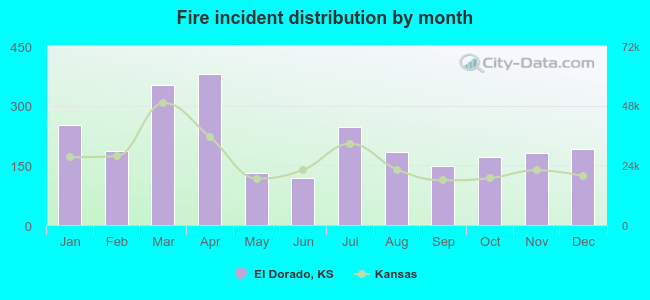 Based on the 2,539 incident reports from years 2002 - 2018 most fires (14.9%) took place during April, and the least (4.6%) in June.
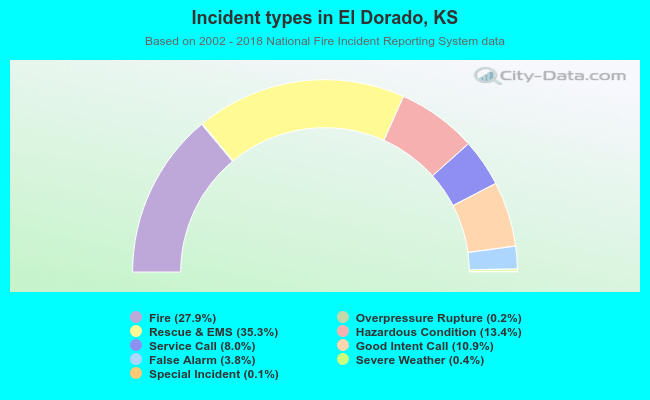 Out of all 9,114 cases reported during the years 2002 - 2018, the most belonged to the categories: Rescue & EMS (35.3%), Fire (27.9%), and Hazardous Condition (13.4%).
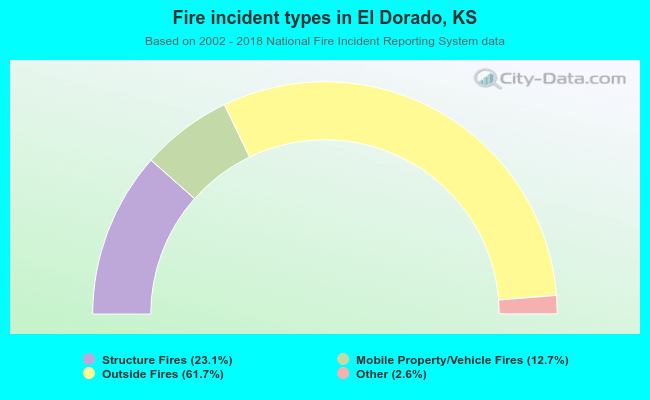 When looking into fire subcategories, the most reports belonged to: Outside Fires (61.7%), and Structure Fires (23.1%).