Durango: Fire Incidents, Colorado (CO)
Where are fire incidents reported in Durango, CO
Something went wrong! Please refresh the page.
| Fire incidents reported | |
|---|---|
| Sreet name | Count |
| MAIN AVE | 258 |
| HIGHWAY 550 | 242 |
| HWY 550 | 154 |
| HIGHWAY 160 | 130 |
| CAMINO DEL RIO | 108 |
| COUNTY ROAD 213 | 96 |
| HWY 160 | 86 |
| COUNTY ROAD 250 | 74 |
| FLORIDA RD | 72 |
| 2ND AVE | 68 |
| CR 250 | 66 |
| 3RD AVE | 62 |
| RIM DR | 54 |
| CR 213 | 46 |
| COUNTY ROAD 203 | 44 |
| ANIMAS VIEW DR | 42 |
| COUNTY ROAD 207 | 38 |
| CR 203 | 36 |
| 6TH AVE | 34 |
| COLLEGE DR | 34 |
| COUNTY ROAD 204 | 34 |
| COUNTY ROAD 240 | 32 |
| GOEGLEIN GULCH RD | 32 |
| 4TH AVE | 30 |
| ARROYO DR | 28 |
| CR 240 | 26 |
| 8TH AVE | 24 |
| COUNTY ROAD 222 | 24 |
| COUNTY ROAD 232 | 24 |
| CR 207 | 24 |
| Other | 286 |
2002 - 2018 National Fire Incident Reporting System (NFIRS) incidents
- Incident types reported to NFIRS in Durango, CO
- 16,85162.6%Rescue & EMS
- 3,32212.3%Good Intent Call
- 2,3088.6%Fire
- 2,2148.2%Hazardous Condition
- 1,2084.5%False Alarm
- 9853.7%Service Call
- Fire incident types reported to NFIRS in Durango, CO
- 1,23953.7%Outside Fires
- 74132.1%Structure Fires
- 2299.9%Mobile Property/Vehicle Fires
- 994.3%Other
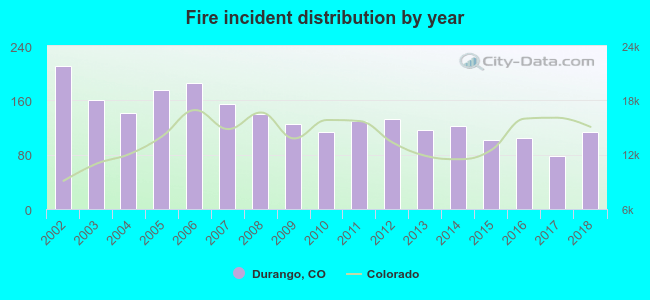 According to the data from the years 2002 - 2018 the average number of fire incidents per year is 136. The highest number of fire incidents - 211 took place in 2002, and the least - 78 in 2017. The data has a decreasing trend.
 The median response time based on all reported fire incidents is 10 minutes. This is higher compared to the Colorado median value.
The median response time in Durango, CO compared to nearest cities:
(Note: Based on data for all years, including only cities with at least 500 fire incidents)
| Durango: | 10 minutes |
| Bayfield: | 12 minutes |
| Ignacio: | 11 minutes |
| Cortez: | 9 minutes |
| Pagosa Springs: | 11 minutes |
| Montrose: | 8 minutes |
 According to the data from the years 2002 - 2018 the average number of fire-related casualties per year is 0. The highest number of reported injuries - 2 took place in 2003, and the lowest - 0 in 2002. The data has a constant trend.
The average number of injuries per 1,000 fire incidents is 2. This indicator was the highest - 13 in 2003, and the lowest 0 in 2002. The trend for casualties per 1,000 fire incidents is constant. Compared to the Colorado value the number of casualties per 1,000 incidents is much lower.
According to the data from the years 2002 - 2018 the average number of fire-related casualties per year is 0. The highest number of reported injuries - 2 took place in 2003, and the lowest - 0 in 2002. The data has a constant trend.
The average number of injuries per 1,000 fire incidents is 2. This indicator was the highest - 13 in 2003, and the lowest 0 in 2002. The trend for casualties per 1,000 fire incidents is constant. Compared to the Colorado value the number of casualties per 1,000 incidents is much lower.Casualties per 1,000 incidents in Durango, CO compared to nearest cities:
(Note: Based on data for all years, including only cities with at least 500 fire incidents)
| Durango: | 2.2 |
| Bayfield: | 10.8 |
| Ignacio: | 0.9 |
| Cortez: | 0.5 |
| Pagosa Springs: | 3.2 |
| Montrose: | 13.9 |
 29.5% incidents where reported in the morning and 70.5% in the evening. The most fires (15.3%) took place on Saturday, and the least (13.4%) on Thursday.
 According to the 2,308 incident reports from years 2002 - 2018 most fires (15.4%) took place during July, and the least (4.5%) in January.
 Out of all 26,932 cases reported during the years 2002 - 2018, the most belonged to the categories: Rescue & EMS (62.6%), Good Intent Call (12.3%), and Fire (8.6%).
 When looking into fire subcategories, the most reports belonged to: Outside Fires (53.7%), and Structure Fires (32.1%).