Downingtown: Fire Incidents, Pennsylvania (PA)
Where are fire incidents reported in Downingtown, PA
Something went wrong! Please refresh the page.
| Fire incidents reported | |
|---|---|
| Sreet name | Count |
| LANCASTER AV | 186 |
| NORWOOD HOUSE RD | 166 |
| PLAZA DR | 134 |
| LANCASTER | 98 |
| LANCASTER AVE | 88 |
| BOOT RD | 66 |
| UWCHLAN AV | 52 |
| MANOR AV | 48 |
| CHESTNUT ST | 42 |
| BRANDYWINE AV | 36 |
| CAMPBELL CI | 32 |
| LINCOLN HW | 32 |
| MARY ST | 32 |
| HORSESHOE PK | 30 |
| BRADFORD AV | 28 |
| HOPEWELL RD | 28 |
| PENNSYLVANIA AV | 28 |
| WOODBINE RD | 26 |
| GLENSIDE RD | 24 |
| LLOYD AV | 24 |
| MARSHALLTON THORNDALE RD | 24 |
| BLACK HAWK CI | 22 |
| MEADOWLAKE DR | 22 |
| HIGHLAND AV | 20 |
| LINCOLN | 20 |
| PENNSYLVANIA AVE | 20 |
| WALLACE AV | 20 |
| CREEK RD | 18 |
| TRESTLE PL | 18 |
| WASHINGTON AV | 18 |
| Other | 289 |
2003 - 2018 National Fire Incident Reporting System (NFIRS) incidents
- Incident types reported to NFIRS in Downingtown, PA
- 1,69127.2%Fire
- 1,26520.4%Hazardous Condition
- 1,25420.2%Good Intent Call
- 83813.5%Rescue & EMS
- 81613.1%False Alarm
- 3345.4%Service Call
- Fire incident types reported to NFIRS in Downingtown, PA
- 1,11766.1%Structure Fires
- 37021.9%Outside Fires
- 1337.9%Mobile Property/Vehicle Fires
- 714.2%Other
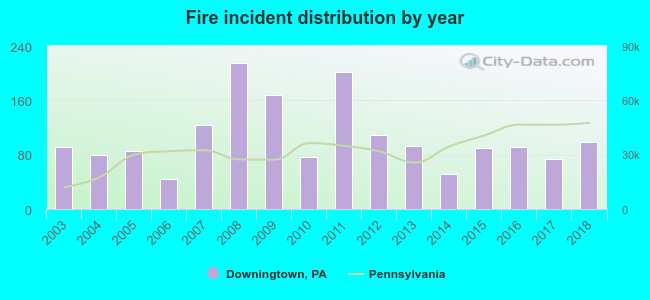 Based on the data from the years 2003 - 2018 the average number of fire incidents per year is 106. The highest number of reported fire incidents - 215 took place in 2008, and the least - 44 in 2006. The data has an increasing trend.
The average number of yearly fire incidents per 10k residents in Downingtown, PA compared to nearest cities:
(Note: Based on data for the last 3 years, including only cities with population 5,000 and above)
| Downingtown: | 110.0 |
| Coatesville: | 118.0 |
| West Chester: | 56.6 |
| Kennett Square: | 71.0 |
| Paoli: | 18.5 |
| Phoenixville: | 65.7 |
| Audubon: | 30.8 |
| Pottstown: | 58.2 |
| Media: | 151.6 |
 The median response time based on all reported fire incidents is 8 minutes. This is higher compared to the state median value.
The median response time in Downingtown, PA compared to nearest cities:
(Note: Based on data for all years, including only cities with at least 500 fire incidents)
| Downingtown: | 8 minutes |
| Exton: | 6 minutes |
| Coatesville: | 5 minutes |
| West Chester: | 8 minutes |
| Malvern: | 9 minutes |
| Kennett Square: | 8 minutes |
| Parkesburg: | 9 minutes |
| Honey Brook: | 8 minutes |
| Phoenixville: | 6 minutes |
 According to the data from the years 2003 - 2018 the average number of fire-related casualties per year is 0. The highest number of reported injuries - 2 took place in 2004, and the lowest - 0 in 2003. The data has a constant trend.
The average number of injuries per 1,000 fires is 4. This indicator was the highest - 25 in 2004, and the lowest 0 in 2003. The trend for injuries per 1,000 incidents is constant. Compared to the Pennsylvania value the number of injuries per 1,000 fires is lower.
According to the data from the years 2003 - 2018 the average number of fire-related casualties per year is 0. The highest number of reported injuries - 2 took place in 2004, and the lowest - 0 in 2003. The data has a constant trend.
The average number of injuries per 1,000 fires is 4. This indicator was the highest - 25 in 2004, and the lowest 0 in 2003. The trend for injuries per 1,000 incidents is constant. Compared to the Pennsylvania value the number of injuries per 1,000 fires is lower.Casualties per 1,000 incidents in Downingtown, PA compared to nearest cities:
(Note: Based on data for all years, including only cities with at least 500 fire incidents)
| Downingtown: | 3.5 |
| Exton: | 7.9 |
| Coatesville: | 7.0 |
| West Chester: | 13.5 |
| Malvern: | 7.7 |
| Kennett Square: | 3.4 |
| Parkesburg: | 0.0 |
| Honey Brook: | 3.3 |
| Phoenixville: | 14.0 |
 31.5% incidents where reported in the morning and 68.5% in the evening. The most fires (15.8%) took place on Sunday, and the least (13.0%) on Wednesday.
 According to the 1,691 reports from years 2003 - 2018 most fires (12.6%) took place during January, and the least (4.7%) in November.
 Out of all 6,208 cases reported during the years 2003 - 2018, the most belonged to the categories: Fire (27.2%), Hazardous Condition (20.4%), and Good Intent Call (20.2%).
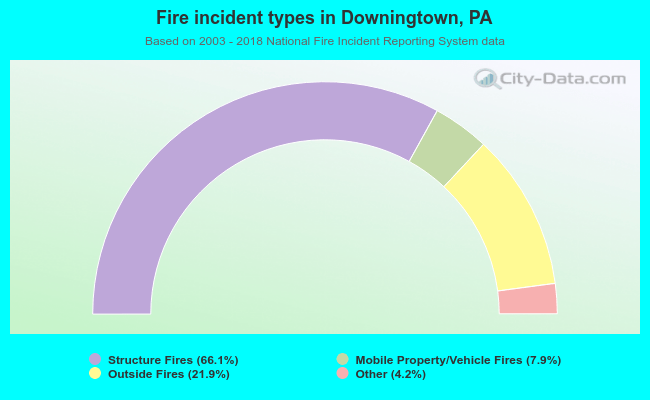 When looking into fire subcategories, the most incidents belonged to: Structure Fires (66.1%), and Outside Fires (21.9%).