Denison: Fire Incidents, Texas (TX)
Where are fire incidents reported in Denison, TX
Something went wrong! Please refresh the page.
| Fire incidents reported | |
|---|---|
| Sreet name | Count |
| USHY 75 | 258 |
| FM 120 | 100 |
| MORTON ST | 92 |
| US HWY 75 | 92 |
| TEXAS ST | 90 |
| CRAWFORD ST | 78 |
| MAIN | 68 |
| PRESTON RD | 66 |
| USHY 69 | 64 |
| FM 1753 | 60 |
| HULL ST | 56 |
| MORTON | 54 |
| SPUR 503 | 54 |
| BOND ST | 48 |
| MONTEREY ST | 46 |
| WALKER ST | 46 |
| SEARS ST | 44 |
| AUSTIN AVE | 42 |
| DAY | 42 |
| TEXOMA | 42 |
| HULL | 40 |
| STHY 91 | 40 |
| FANNIN | 38 |
| GANDY ST | 38 |
| MIRICK AVE | 38 |
| STATE HWY 91 | 38 |
| US HWY 69 | 38 |
| AUSTIN | 36 |
| FM 1417 | 36 |
| MAIN ST | 36 |
| Other | 1,509 |
2002 - 2018 National Fire Incident Reporting System (NFIRS) incidents
- Incident types reported to NFIRS in Denison, TX
- 16,32363.6%Rescue & EMS
- 3,32913.0%Fire
- 2,0958.2%Hazardous Condition
- 1,8077.0%Good Intent Call
- 1,2094.7%Service Call
- 8513.3%False Alarm
- 420.2%Special Incident
- Fire incident types reported to NFIRS in Denison, TX
- 1,84155.3%Outside Fires
- 92627.8%Structure Fires
- 46714.0%Mobile Property/Vehicle Fires
- 952.9%Other
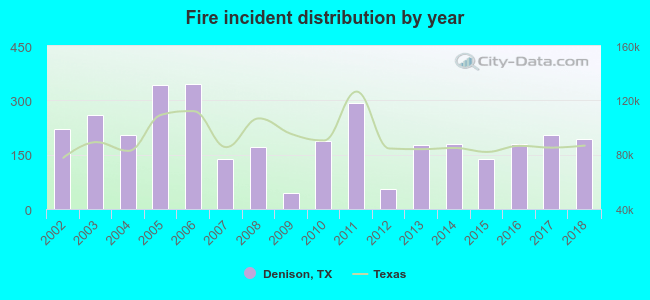 According to the data from the years 2002 - 2018 the average number of fire incidents per year is 196. The highest number of fire incidents - 345 took place in 2006, and the least - 43 in 2009. The data has a dropping trend.
 The median response time based on all reported fire incidents is 7 minutes. This is close to the Texas median value.
The median response time in Denison, TX compared to nearest cities:
(Note: Based on data for all years, including only cities with at least 500 fire incidents)
| Denison: | 7 minutes |
| Pottsboro: | 8 minutes |
| Colbert: | 8 minutes |
| Sherman: | 6 minutes |
| Bells: | 10 minutes |
| Whitewright: | 11 minutes |
| Kingston: | 8 minutes |
| Durant: | 4 minutes |
| Whitesboro: | 11 minutes |
 According to the data from the years 2002 - 2018 the average number of fire-related fatalities per year is 1. The highest number of reported deaths - 3 took place in 2005, and the lowest - 0 in 2003. The data has a dropping trend.
The average number of deaths per 1,000 fire incidents is 2. This indicator was the highest - 10 in 2004, and the lowest 0 in 2003. The trend for fatalities per 1,000 fires is dropping. Compared to the Texas value the number of fatalities per 1,000 fire incidents is higher.
According to the data from the years 2002 - 2018 the average number of fire-related fatalities per year is 1. The highest number of reported deaths - 3 took place in 2005, and the lowest - 0 in 2003. The data has a dropping trend.
The average number of deaths per 1,000 fire incidents is 2. This indicator was the highest - 10 in 2004, and the lowest 0 in 2003. The trend for fatalities per 1,000 fires is dropping. Compared to the Texas value the number of fatalities per 1,000 fire incidents is higher.Deaths per 1,000 incidents in Denison, TX compared to nearest cities:
(Note: Based on data for all years, including only cities with at least 2,500 fire incidents)
| Denison: | 2.7 |
| Sherman: | 2.5 |
| Durant: | 1.1 |
| Gainesville: | 1.4 |
 Based on the reports from the years 2002 - 2018 the average number of fire-related yearly casualties is 3. The highest number of injuries - 13 took place in 2002, and the lowest - 0 in 2008. The data has a dropping trend.
The average number of casualties per 1,000 fires is 11. This indicator was the highest - 59 in 2002, and the lowest 0 in 2008. The trend for injuries per 1,000 fires is decreasing. Compared to the Texas value the number of injuries per 1,000 incidents is higher.
Based on the reports from the years 2002 - 2018 the average number of fire-related yearly casualties is 3. The highest number of injuries - 13 took place in 2002, and the lowest - 0 in 2008. The data has a dropping trend.
The average number of casualties per 1,000 fires is 11. This indicator was the highest - 59 in 2002, and the lowest 0 in 2008. The trend for injuries per 1,000 fires is decreasing. Compared to the Texas value the number of injuries per 1,000 incidents is higher.Casualties per 1,000 incidents in Denison, TX compared to nearest cities:
(Note: Based on data for all years, including only cities with at least 500 fire incidents)
| Denison: | 13.5 |
| Pottsboro: | 1.2 |
| Colbert: | 1.9 |
| Sherman: | 8.7 |
| Bells: | 1.5 |
| Whitewright: | 0.0 |
| Kingston: | 2.9 |
| Durant: | 2.2 |
| Whitesboro: | 0.9 |
 29.1% incidents where reported in the morning and 70.9% in the evening. The most fires (15.6%) took place on Saturday, and the least (11.4%) on Thursday.
 Based on the 3,329 incident reports from years 2002 - 2018 most fires (11.8%) took place during July, and the least (5.3%) in May.
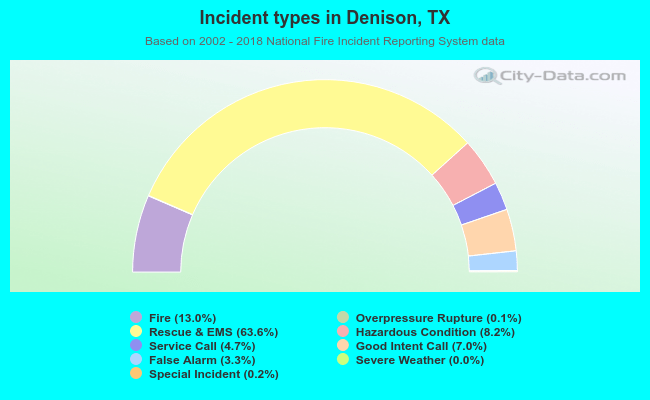 Out of all 25,678 cases reported during the years 2002 - 2018, the most belonged to the categories: Rescue & EMS (63.6%), Fire (13.0%), and Hazardous Condition (8.2%).
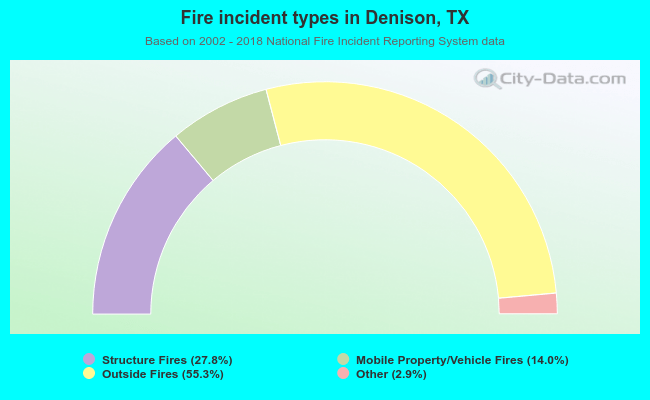 When looking into fire subcategories, the most incidents belonged to: Outside Fires (55.3%), and Structure Fires (27.8%).