Decorah: Fire Incidents, Iowa (IA)
Where are fire incidents reported in Decorah, IA
Something went wrong! Please refresh the page.
|
| |||||||||||||||||||||||||||||||||||||||||||||||||||||||||||||||||||||||||||||||||||||||||||||||||||||||||||||
| Other | 210 | |||||||||||||||||||||||||||||||||||||||||||||||||||||||||||||||||||||||||||||||||||||||||||||||||||||||||||||
2004 - 2018 National Fire Incident Reporting System (NFIRS) incidents
- Incident types reported to NFIRS in Decorah, IA
- 51647.6%Fire
- 14913.7%Rescue & EMS
- 12911.9%Hazardous Condition
- 11410.5%Good Intent Call
- 978.9%Service Call
- 656.0%False Alarm
- 60.6%Severe Weather
- 60.6%Special Incident
- 20.2%Overpressure Rupture
- Fire incident types reported to NFIRS in Decorah, IA
- 22243.0%Outside Fires
- 20740.1%Structure Fires
- 7614.7%Mobile Property/Vehicle Fires
- 112.1%Other
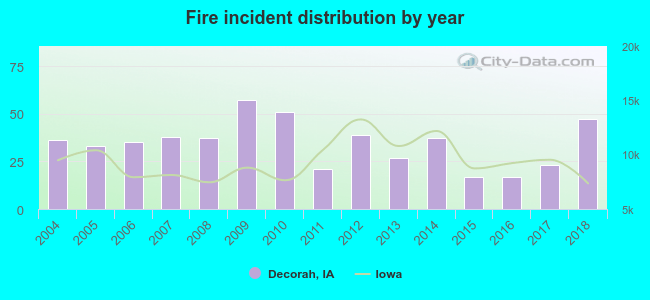 According to the data from the years 2004 - 2018 the average number of fire incidents per year is 34. The highest number of fire incidents - 57 took place in 2009, and the least - 17 in 2015. The data has a growing trend.
The average number of yearly fire incidents per 10k residents in Decorah, IA compared to nearest cities:
(Note: Based on data for the last 3 years, including only cities with population 5,000 and above)
| Decorah: | 36.4 |
 The median response time based on all reported fire incidents is 9 minutes. This is higher than the Iowa median value.
The median response time in Decorah, IA compared to nearest cities:
(Note: Based on data for all years, including only cities with at least 500 fire incidents)
| Decorah: | 9 minutes |
 29.8% incidents where reported in the morning and 70.2% in the evening. The most fires (17.8%) took place on Sunday, and the least (12.6%) on Thursday.
 Based on the 516 fire incident reports from years 2004 - 2018 most fires (21.1%) took place during April, and the least (4.7%) in February.
 Out of all 1,084 cases reported during the years 2004 - 2018, the most belonged to the categories: Fire (47.6%), Rescue & EMS (13.7%), and Hazardous Condition (11.9%).
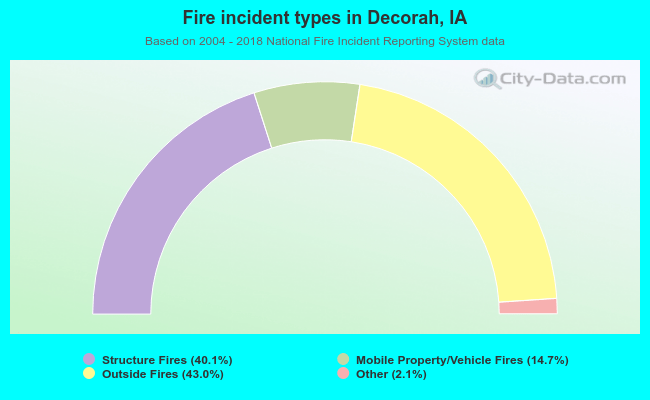 When looking into fire subcategories, the most incidents belonged to: Outside Fires (43.0%), and Structure Fires (40.1%).