| Fire incidents reported |
|---|
| Sreet name | Count |
|---|
| HWY 71 N | 16 | | HWY 70 W | 10 | | CROSS TRAILS ROAD | 6 | | 215 RED CUT ROAD | 4 | | 9TH ST | 4 | | COLLIN RAYE DR | 4 | | CROSS TRAILS | 4 | | DE QUEEN LAKE ROAD | 4 | | DOGTOWN RD | 4 | | DOGTOWN ROAD | 4 | | DUNN ROAD | 4 | | HWY 329 | 4 | | HWY 41 SOUTH | 4 | | JOHNSON BRIDGE RD | 4 | | LONE PINE | 4 | | MT PLEASANT RD | 4 | | PLEASANT HILL RD | 4 | | RED BRIDGE RD | 4 | | RINK RD | 4 | | TREATING PLANT RD | 4 | | 100 JOHNSON LN | 2 | | 103 RIVER ROAD | 2 | | 103 SWIFT RD | 2 | | 104 MULLEN DRIVE | 2 | | 1095 HWY 71 NORTH | 2 |
| | | Fire incidents reported |
|---|
| Sreet name | Count |
|---|
| 1105 W MAPLE AVE | 2 | | 1112 ROLLER AV | 2 | | 116 BEN AV | 2 | | 116 NORTHGATE | 2 | | 1168 HWY 70 EAST | 2 | | 117 BURR ST | 2 | | 118 FARM TO MARKET RD | 2 | | 1219 N 6TH ST | 2 | | 123 CORVETTE LANE | 2 | | 123 CRESTWOOD DRIVE | 2 | | 123 RIDGEWAY RD | 2 | | 132 EAST ROBINSON RD | 2 | | 1390 US70 | 2 | | 13TH ST | 2 | | 1406 HWY 7071 EAST | 2 | | 1466 HWY 7071 E | 2 | | 1498 W COLLIN RAYE | 2 | | 151 PROVO ROAD | 2 | | 155 RIDGEWAY RD | 2 | | 1569 RED BRIDGE ROAD | 2 | | 163 COOLEY LANE | 2 | | 165 GARDNER CHAPEL | 2 | | 1700 HWY 70 EAST | 2 | | 172 CHAPEL HILL RD | 2 | | |
|
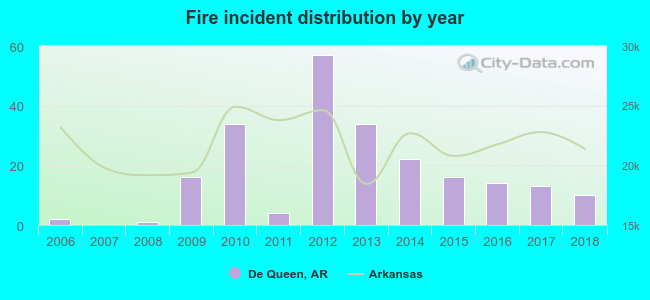 Based on the data from the years 2006 - 2018 the average number of fires per year is 17. The highest number of reported fire incidents - 57 took place in 2012, and the least - 0 in 2007. The data has a growing trend.
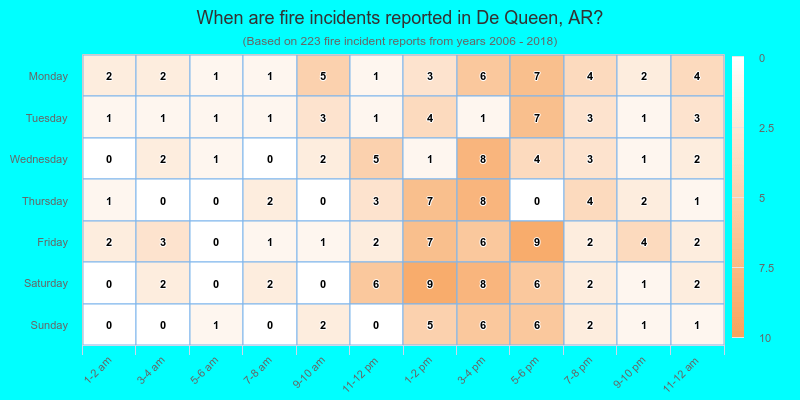
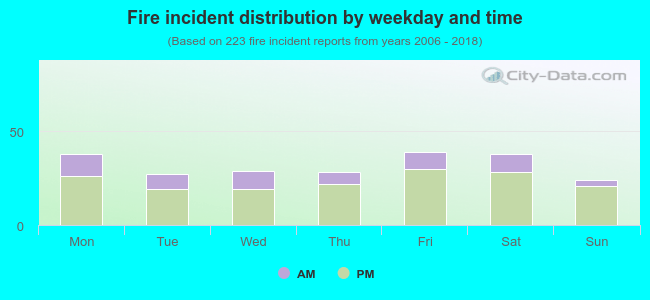 26.0% incidents where reported in the morning and 74.0% in the evening. The most fires (17.5%) took place on Friday, and the least (10.8%) on Sunday.
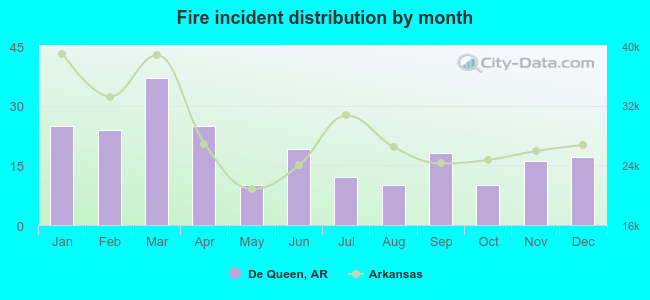 According to the 223 fires from years 2006 - 2018 most fires (16.6%) took place during March, and the least (4.5%) in May.
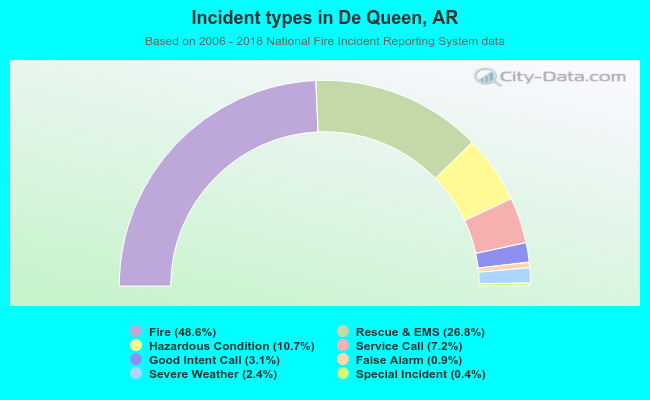 Out of all 459 cases reported during the years 2006 - 2018, the most belonged to the categories: Fire (48.6%), Overpressure Rupture (26.8%), and Rescue & EMS (10.7%).
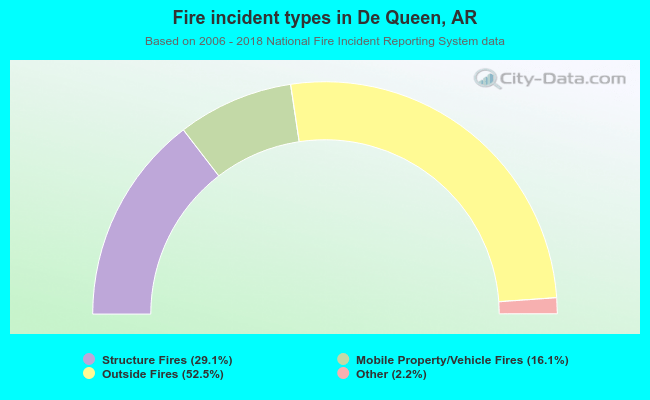 When looking into fire subcategories, the most reports belonged to: Outside Fires (52.5%), and Structure Fires (29.1%).