Country Club Hills: Fire Incidents, Illinois (IL)
Where are fire incidents reported in Country Club Hills, IL
Something went wrong! Please refresh the page.
| Fire incidents reported | |
|---|---|
| Sreet name | Count |
| 183RD ST | 134 |
| 167TH ST | 130 |
| 175TH ST | 84 |
| BAKER AVE | 70 |
| 167TH PL | 66 |
| FLOSSMOOR RD | 64 |
| PROVINCETOWN DR | 62 |
| 175TH PL | 58 |
| GATLING BLVD | 58 |
| 173RD ST | 44 |
| PULASKI RD | 40 |
| WINDSOR | 36 |
| 179TH ST | 34 |
| BAKER | 34 |
| 169TH ST | 32 |
| 176TH PL | 32 |
| ANTHONY | 32 |
| ANTHONY AVE | 32 |
| CICERO AVE | 32 |
| 168TH PL | 30 |
| 189TH ST | 30 |
| 186TH ST | 28 |
| CENTRAL PARK AVE | 28 |
| CYPRESS AVE | 28 |
| 177TH ST | 26 |
| 185TH ST | 24 |
| MAPLE AVE | 24 |
| 168TH ST | 22 |
| ARLINGTON | 22 |
| KOSTNER AVE | 20 |
| Other | 302 |
2002 - 2018 National Fire Incident Reporting System (NFIRS) incidents
- Incident types reported to NFIRS in Country Club Hills, IL
- 10,42561.7%Rescue & EMS
- 1,80410.7%Hazardous Condition
- 1,6589.8%Fire
- 1,5549.2%False Alarm
- 7324.3%Service Call
- 6914.1%Good Intent Call
- Fire incident types reported to NFIRS in Country Club Hills, IL
- 1,04563.0%Structure Fires
- 37322.5%Outside Fires
- 20512.4%Mobile Property/Vehicle Fires
- 352.1%Other
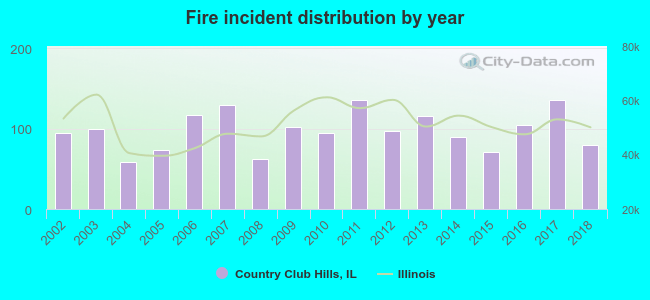 Based on the data from the years 2002 - 2018 the average number of fires per year is 98. The highest number of fire incidents - 135 took place in 2011, and the least - 59 in 2004. The data has a dropping trend.
The average number of yearly fire incidents per 10k residents in Country Club Hills, IL compared to nearest cities:
(Note: Based on data for the last 3 years, including only cities with population 5,000 and above)
| Country Club Hills: | 63.0 |
| Hazel Crest: | 57.3 |
| Flossmoor: | 55.0 |
| Markham: | 111.1 |
| Homewood: | 44.9 |
| Olympia Fields: | 19.8 |
| Oak Forest: | 31.2 |
| Matteson: | 55.2 |
| Tinley Park: | 26.4 |
 The median response time based on all reported fire incidents is 5 minutes. This is close to the state median value.
The median response time in Country Club Hills, IL compared to nearest cities:
(Note: Based on data for all years, including only cities with at least 500 fire incidents)
| Country Club Hills: | 5 minutes |
| Hazel Crest: | 5 minutes |
| Flossmoor: | 6 minutes |
| Markham: | 5 minutes |
| Homewood: | 5 minutes |
| Oak Forest: | 5 minutes |
| Matteson: | 6 minutes |
| Tinley Park: | 6 minutes |
| Midlothian: | 4 minutes |
 Based on the data from the years 2002 - 2018 the average number of fire-related yearly casualties is 1. The highest number of injuries - 5 took place in 2006, and the lowest - 0 in 2002. The data has a constant trend.
The average number of casualties per 1,000 fire incidents is 5. This indicator was the highest - 43 in 2006, and the lowest 0 in 2002. The trend for casualties per 1,000 fires is constant. Compared to the state value the number of casualties per 1,000 fires is lower.
Based on the data from the years 2002 - 2018 the average number of fire-related yearly casualties is 1. The highest number of injuries - 5 took place in 2006, and the lowest - 0 in 2002. The data has a constant trend.
The average number of casualties per 1,000 fire incidents is 5. This indicator was the highest - 43 in 2006, and the lowest 0 in 2002. The trend for casualties per 1,000 fires is constant. Compared to the state value the number of casualties per 1,000 fires is lower.Casualties per 1,000 incidents in Country Club Hills, IL compared to nearest cities:
(Note: Based on data for all years, including only cities with at least 500 fire incidents)
| Country Club Hills: | 6.0 |
| Hazel Crest: | 11.5 |
| Flossmoor: | 17.8 |
| Markham: | 0.0 |
| Homewood: | 19.1 |
| Oak Forest: | 11.3 |
| Matteson: | 21.6 |
| Tinley Park: | 4.7 |
| Midlothian: | 29.2 |
 32.6% incidents where reported in the morning and 67.4% in the evening. The most fires (16.3%) took place on Monday, and the least (13.2%) on Saturday.
 Based on the 1,658 fire incident reports from years 2002 - 2018 most fires (11.3%) took place during May, and the least (5.0%) in September.
 Out of all 16,892 cases reported during the years 2002 - 2018, the most belonged to the categories: Rescue & EMS (61.7%), Hazardous Condition (10.7%), and Fire (9.8%).
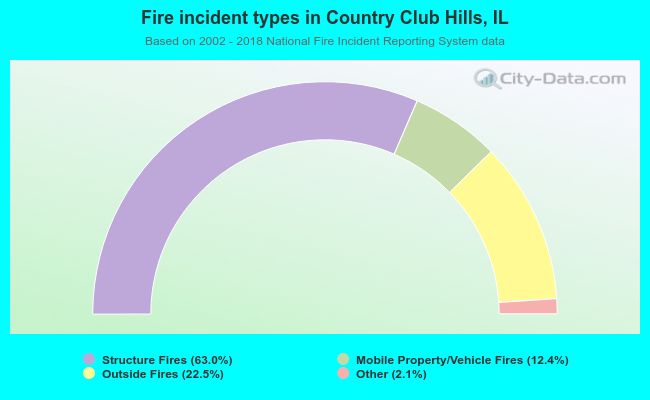 When looking into fire subcategories, the most reports belonged to: Structure Fires (63.0%), and Outside Fires (22.5%).