Collingdale: Fire Incidents, Pennsylvania (PA)
Where are fire incidents reported in Collingdale, PA
Something went wrong! Please refresh the page.
| Fire incidents reported | |
|---|---|
| Sreet name | Count |
| MACDADE BLVD | 220 |
| JACKSON AVE | 76 |
| SPRINGFIELD RD | 64 |
| CLIFTON AVE | 50 |
| LAFAYETTE AVE | 50 |
| PUSEY AVE | 50 |
| SHARON AVE | 44 |
| ROBERTA AVE | 40 |
| CHESTER PIKE | 36 |
| CLIFTON AVE AVE | 34 |
| CHERRY ST | 32 |
| SPRUCE ST | 32 |
| WOODLAWN AVE | 28 |
| ANDREWS AVE | 26 |
| BROAD ST | 24 |
| FELTON AVE | 24 |
| PITMAN AVE | 24 |
| BARTRAM AVE | 22 |
| WAYNE AVE | 22 |
| KERN ST | 20 |
| WALNUT ST | 20 |
| WESTMONT DR | 18 |
| CHESTNUT ST | 16 |
| COLLINGDALE AVE | 16 |
| LINCOLN AVE | 16 |
| NORTH ST | 16 |
| OAK LN | 16 |
| BEDFORD AVE | 14 |
| BEECHWOOD AVE | 14 |
| ASH AVE | 12 |
2003 - 2018 National Fire Incident Reporting System (NFIRS) incidents
- Incident types reported to NFIRS in Collingdale, PA
- 67340.9%Fire
- 42225.6%Hazardous Condition
- 20712.6%Good Intent Call
- 1378.3%Rescue & EMS
- 1338.1%False Alarm
- 674.1%Service Call
- 60.4%Special Incident
- Fire incident types reported to NFIRS in Collingdale, PA
- 34250.8%Structure Fires
- 14721.8%Outside Fires
- 14521.5%Other
- 395.8%Mobile Property/Vehicle Fires
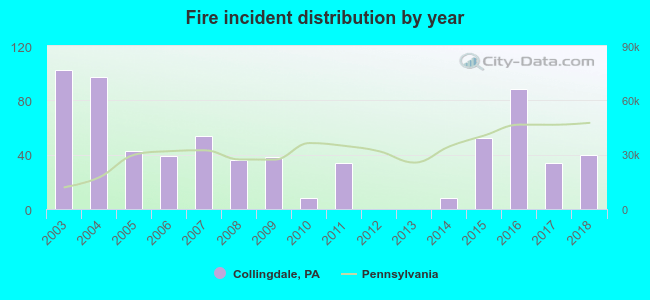 Based on the data from the years 2003 - 2018 the average number of fires per year is 42. The highest number of fire incidents - 102 took place in 2003, and the least - 0 in 2012. The data has a declining trend.
The average number of yearly fire incidents per 10k residents in Collingdale, PA compared to nearest cities:
(Note: Based on data for the last 3 years, including only cities with population 5,000 and above)
| Collingdale: | 61.4 |
| Sharon Hill: | 129.7 |
| Darby Township: | 6.2 |
| Darby: | 116.6 |
| Glenolden: | 98.5 |
| Clifton Heights: | 46.0 |
| Folcroft: | 66.3 |
| Lansdowne: | 63.3 |
| Yeadon: | 98.3 |
 The median response time based on all reported fire incidents is 4 minutes. This is lower compared to the Pennsylvania median value.
The median response time in Collingdale, PA compared to nearest cities:
(Note: Based on data for all years, including only cities with at least 500 fire incidents)
| Collingdale: | 4 minutes |
| Darby: | 5 minutes |
| Yeadon: | 5 minutes |
| Broomall: | 6 minutes |
| Paulsboro: | 8 minutes |
| Media: | 6 minutes |
| Brookhaven: | 3 minutes |
| Chester: | 4 minutes |
| Woodbury: | 7 minutes |
 25.9% incidents where reported in the morning and 74.1% in the evening. The most fires (16.5%) took place on Wednesday, and the least (12.5%) on Sunday.
 According to the 673 incident reports from years 2003 - 2018 most fires (10.4%) took place during June, and the least (4.8%) in October.
 Out of all 1,646 cases reported during the years 2003 - 2018, the most belonged to the categories: Fire (40.9%), Hazardous Condition (25.6%), and Good Intent Call (12.6%).
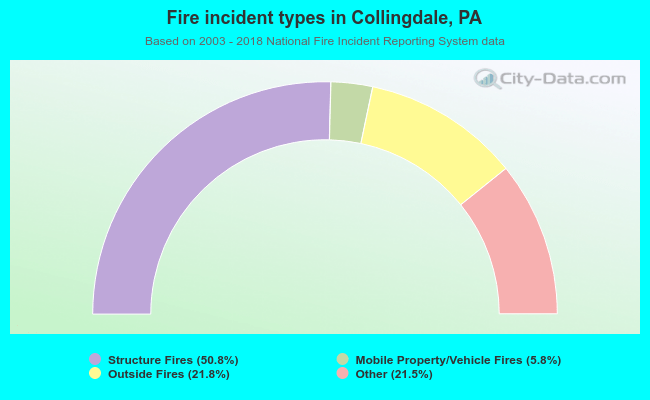 When looking into fire subcategories, the most reports belonged to: Structure Fires (50.8%), and Outside Fires (21.8%).