Clarksville: Fire Incidents, Tennessee (TN)
Where are fire incidents reported in Clarksville, TN
Something went wrong! Please refresh the page.
| Fire incidents reported | |
|---|---|
| Sreet name | Count |
| WILMA RUDOLPH BLVD | 618 |
| FORT CAMPBELL BLVD | 536 |
| MADISON ST | 482 |
| RIVERSIDE DR | 240 |
| TINY TOWN RD | 218 |
| PEACHERS MILL RD | 216 |
| I-24 INTR | 164 |
| DOVER RD | 140 |
| PROVIDENCE BLVD | 134 |
| TRENTON RD | 134 |
| LAFAYETTE RD | 130 |
| NEEDMORE RD | 126 |
| MEMORIAL DR | 124 |
| 101ST AIRBORNE DIV PKWY | 118 |
| POWER ST | 118 |
| COLLEGE ST | 116 |
| ROSSVIEW RD | 116 |
| ASHLAND CITY RD | 114 |
| INTERNATIONAL BLVD | 112 |
| FRANKLIN ST | 110 |
| CUMBERLAND DR | 106 |
| DUNBAR CAVE RD | 98 |
| DUNLOP LN | 98 |
| JACK MILLER BLVD | 98 |
| TYLERTOWN RD | 98 |
| TOBACCO RD | 96 |
| KRAFT ST | 88 |
| 2ND ST | 84 |
| EVANS RD | 80 |
| PARADISE HILL RD | 78 |
| Other | 5,613 |
2002 - 2018 National Fire Incident Reporting System (NFIRS) incidents
- Incident types reported to NFIRS in Clarksville, TN
- 46,80459.8%Rescue & EMS
- 10,60313.6%Fire
- 6,8408.7%Good Intent Call
- 6,8148.7%False Alarm
- 4,8986.3%Hazardous Condition
- 1,9032.4%Service Call
- 1560.2%Special Incident
- 1050.1%Overpressure Rupture
- 1000.1%Severe Weather
- Fire incident types reported to NFIRS in Clarksville, TN
- 4,79845.3%Outside Fires
- 3,36031.7%Structure Fires
- 1,89817.9%Mobile Property/Vehicle Fires
- 5475.2%Other
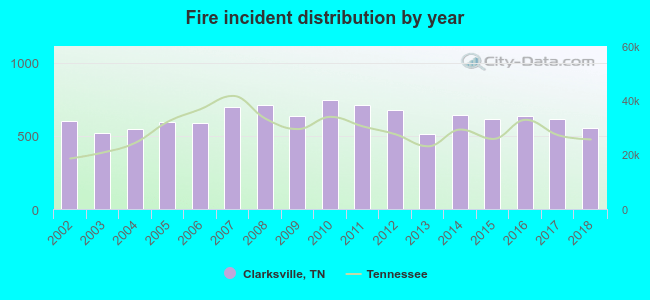 According to the data from the years 2002 - 2018 the average number of fire incidents per year is 624. The highest number of reported fire incidents - 744 took place in 2010, and the least - 512 in 2013. The data has a declining trend.
The average number of yearly fire incidents per 10k residents in Clarksville, TN compared to nearest cities:
(Note: Based on data for the last 3 years, including only cities with population 5,000 and above)
| Clarksville: | 41.0 |
| Springfield: | 74.2 |
| Greenbrier: | 112.2 |
| Dickson: | 108.3 |
| Millersville: | 28.0 |
| White House: | 48.0 |
| Goodlettsville: | 52.6 |
| Fairview: | 28.4 |
| Hendersonville: | 16.0 |
 The median response time based on all reported fire incidents is 5 minutes. This is lower compared to the Tennessee median value.
The median response time in Clarksville, TN compared to nearest cities:
(Note: Based on data for all years, including only cities with at least 500 fire incidents)
| Clarksville: | 5 minutes |
| Oak Grove: | 7 minutes |
| Hopkinsville: | 6 minutes |
| Ashland City: | 10 minutes |
| Charlotte: | 7 minutes |
| Springfield: | 4 minutes |
| White Bluff: | 6 minutes |
| Greenbrier: | 8 minutes |
| Russellville: | 5 minutes |
 Based on the reports from the years 2002 - 2018 the average number of fire-related yearly deaths is 1. The highest number of deaths - 5 took place in 2015, and the lowest - 0 in 2003. The data has a constant trend.
The average number of fatalities per 1,000 fire incidents is 2. This indicator was the highest - 8 in 2015, and the lowest 0 in 2003. The trend for fatalities per 1,000 fires is increasing. Compared to the state value the number of deaths per 1,000 fires is lower.
Based on the reports from the years 2002 - 2018 the average number of fire-related yearly deaths is 1. The highest number of deaths - 5 took place in 2015, and the lowest - 0 in 2003. The data has a constant trend.
The average number of fatalities per 1,000 fire incidents is 2. This indicator was the highest - 8 in 2015, and the lowest 0 in 2003. The trend for fatalities per 1,000 fires is increasing. Compared to the state value the number of deaths per 1,000 fires is lower.Deaths per 1,000 incidents in Clarksville, TN compared to nearest cities:
(Note: Based on data for all years, including only cities with at least 2,500 fire incidents)
| Clarksville: | 2.4 |
| Dickson: | 1.0 |
 According to the data from the years 2002 - 2018 the average number of fire-related casualties per year is 11. The highest number of reported injuries - 23 took place in 2017, and the lowest - 6 in 2002. The data has a rising trend.
The average number of injuries per 1,000 fire incidents is 18. This indicator was the highest - 37 in 2017, and the lowest 10 in 2002. The trend for casualties per 1,000 incidents is growing. Compared to the state value the number of injuries per 1,000 incidents is much higher.
According to the data from the years 2002 - 2018 the average number of fire-related casualties per year is 11. The highest number of reported injuries - 23 took place in 2017, and the lowest - 6 in 2002. The data has a rising trend.
The average number of injuries per 1,000 fire incidents is 18. This indicator was the highest - 37 in 2017, and the lowest 10 in 2002. The trend for casualties per 1,000 incidents is growing. Compared to the state value the number of injuries per 1,000 incidents is much higher.Casualties per 1,000 incidents in Clarksville, TN compared to nearest cities:
(Note: Based on data for all years, including only cities with at least 500 fire incidents)
| Clarksville: | 17.8 |
| Oak Grove: | 2.5 |
| Hopkinsville: | 2.8 |
| Ashland City: | 6.7 |
| Charlotte: | 3.3 |
| Springfield: | 9.4 |
| White Bluff: | 0.0 |
| Greenbrier: | 9.7 |
| Russellville: | 1.0 |
 28.7% incidents where reported in the morning and 71.3% in the evening. The most fires (16.7%) took place on Saturday, and the least (13.4%) on Thursday.
 Based on the 10,603 fires from years 2002 - 2018 most fires (9.8%) took place during July, and the least (7.2%) in May.
 Out of all 78,223 cases reported during the years 2002 - 2018, the most belonged to the categories: Rescue & EMS (59.8%), Fire (13.6%), and Good Intent Call (8.7%).
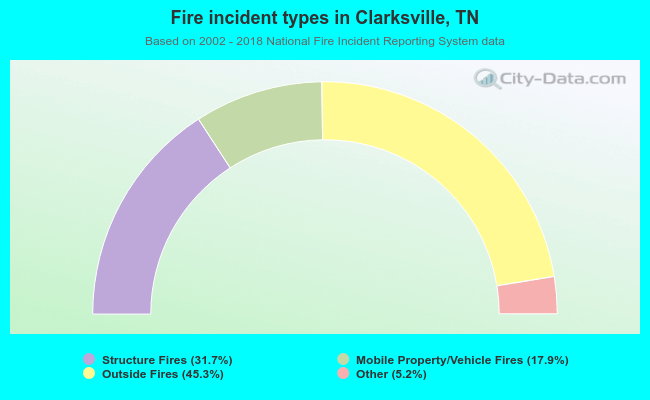 When looking into fire subcategories, the most reports belonged to: Outside Fires (45.3%), and Structure Fires (31.7%).