Clarksville City: Fire Incidents, Texas (TX)
Where are fire incidents reported in Clarksville City, TX
Something went wrong! Please refresh the page.
|
| |||||||||||||||||||||||||||||||||||||||||||||||||||||||||||||||||||||||||||||||||||||||||||||||||
2002 - 2018 National Fire Incident Reporting System (NFIRS) incidents
- Incident types reported to NFIRS in Clarksville City, TX
- 10746.5%Fire
- 5323.0%Hazardous Condition
- 2510.9%Service Call
- 2310.0%Rescue & EMS
- 125.2%Good Intent Call
- 52.2%False Alarm
- 52.2%Severe Weather
- Fire incident types reported to NFIRS in Clarksville City, TX
- 8377.6%Outside Fires
- 1816.8%Structure Fires
- 32.8%Mobile Property/Vehicle Fires
- 32.8%Other
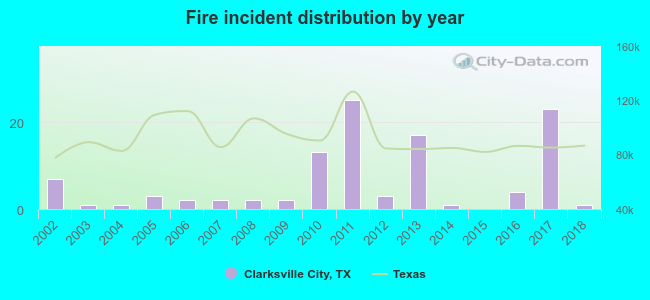 According to the data from the years 2002 - 2018 the average number of fires per year is 6. The highest number of reported fire incidents - 25 took place in 2011, and the least - 0 in 2015. The data has a decreasing trend.
 29.9% incidents where reported in the morning and 70.1% in the evening. The most fires (18.7%) took place on Tuesday, and the least (9.3%) on Monday.
 According to the 107 fires from years 2002 - 2018 most fires (18.7%) took place during August, and the least (2.8%) in June.
 Out of all 230 cases reported during the years 2002 - 2018, the most belonged to the categories: Fire (46.5%), Rescue & EMS (23.0%), and Hazardous Condition (10.9%).
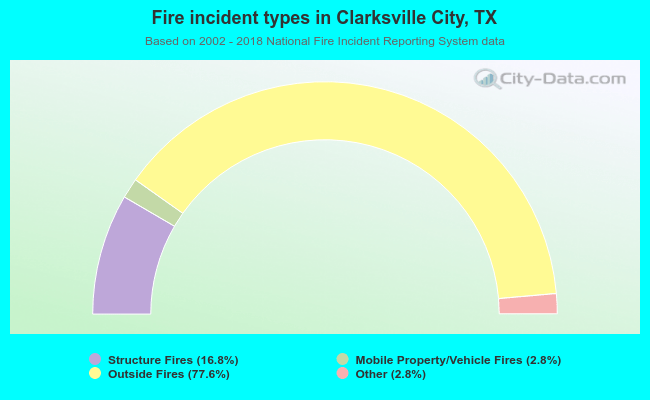 When looking into fire subcategories, the most incidents belonged to: Outside Fires (77.6%), and Structure Fires (16.8%).