Chillum: Fire Incidents, Maryland (MD)
Where are fire incidents reported in Chillum, MD
Something went wrong! Please refresh the page.
| Fire incidents reported | |
|---|---|
| Sreet name | Count |
| RIGGS RD | 172 |
| NEW HAMPSHIRE AVE | 140 |
| METZEROTT RD | 120 |
| 15TH AVE | 116 |
| 14TH AVE | 78 |
| CHILLUM RD | 64 |
| UNIVERSITY BL | 60 |
| UNIVERSITY BLVD | 60 |
| KANAWHA ST | 50 |
| 16TH AVE | 48 |
| 18TH AVE | 44 |
| 23RD AVE | 40 |
| ADELPHI RD | 34 |
| DREXEL ST | 30 |
| MERRIMAC DR | 30 |
| GUILFORD RD | 28 |
| RAY RD | 28 |
| AMHERST RD | 26 |
| FAIRVIEW AVE | 26 |
| SHERIDAN ST | 26 |
| WEST PARK | 26 |
| CYPRESS CREEK DR | 22 |
| 25TH AVE | 20 |
| EASTERN AVE | 20 |
| ERIE ST | 20 |
| SARGENT RD | 20 |
| 24TH AVE | 18 |
| EDWARDS WAY | 18 |
| 19TH AVE | 16 |
| BUCK LODGE RD | 16 |
2009 - 2015 National Fire Incident Reporting System (NFIRS) incidents
- Incident types reported to NFIRS in Chillum, MD
- 1,13246.3%Fire
- 82033.5%Hazardous Condition
- 2128.7%False Alarm
- 1686.9%Service Call
- 803.3%Good Intent Call
- 301.2%Rescue & EMS
- 40.2%Severe Weather
- Fire incident types reported to NFIRS in Chillum, MD
- 54948.5%Structure Fires
- 23620.8%Mobile Property/Vehicle Fires
- 19517.2%Outside Fires
- 15213.4%Other
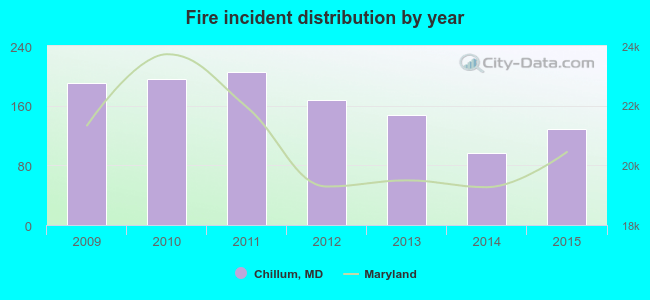 Based on the data from the years 2009 - 2015 the average number of fires per year is 162. The highest number of reported fire incidents - 205 took place in 2011, and the least - 96 in 2014. The data has a dropping trend.
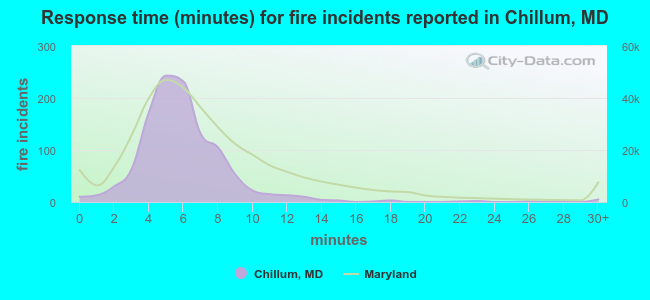 The median response time based on all reported fire incidents is 6 minutes. This is close to the Maryland median value.
The median response time in Chillum, MD compared to nearest cities:
(Note: Based on data for all years, including only cities with at least 500 fire incidents)
| Chillum: | 6 minutes |
| Takoma Park: | 5 minutes |
| Hyattsville: | 5 minutes |
| Bladensburg: | 5 minutes |
| Silver Spring: | 5 minutes |
| Washington: | 4 minutes |
| Landover: | 5 minutes |
| Beltsville: | 6 minutes |
| Lanham: | 7 minutes |
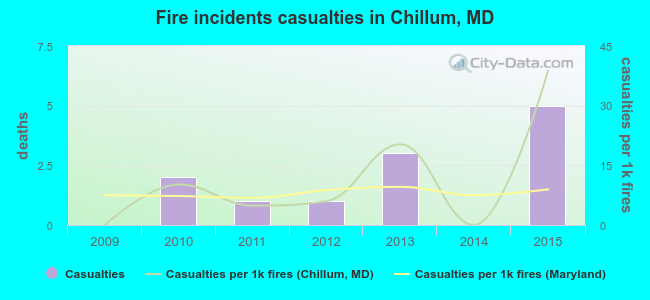 According to the data from the years 2009 - 2015 the average number of fire-related yearly casualties is 2. The highest number of casualties - 5 took place in 2015, and the lowest - 0 in 2009. The data has a growing trend.
The average number of casualties per 1,000 fire incidents is 11. This indicator was the highest - 39 in 2015, and the lowest 0 in 2009. The trend for injuries per 1,000 fire incidents is rising. Compared to the Maryland value the number of injuries per 1,000 incidents is higher.
According to the data from the years 2009 - 2015 the average number of fire-related yearly casualties is 2. The highest number of casualties - 5 took place in 2015, and the lowest - 0 in 2009. The data has a growing trend.
The average number of casualties per 1,000 fire incidents is 11. This indicator was the highest - 39 in 2015, and the lowest 0 in 2009. The trend for injuries per 1,000 fire incidents is rising. Compared to the Maryland value the number of injuries per 1,000 incidents is higher.Casualties per 1,000 incidents in Chillum, MD compared to nearest cities:
(Note: Based on data for all years, including only cities with at least 500 fire incidents)
| Chillum: | 10.6 |
| Takoma Park: | 18.1 |
| Hyattsville: | 2.4 |
| Bladensburg: | 16.8 |
| Silver Spring: | 26.6 |
| Washington: | 1.1 |
| Landover: | 7.1 |
| Beltsville: | 10.0 |
| Lanham: | 14.8 |
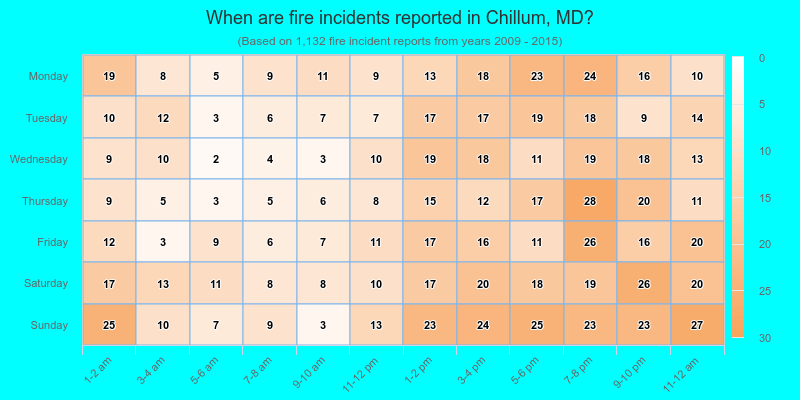
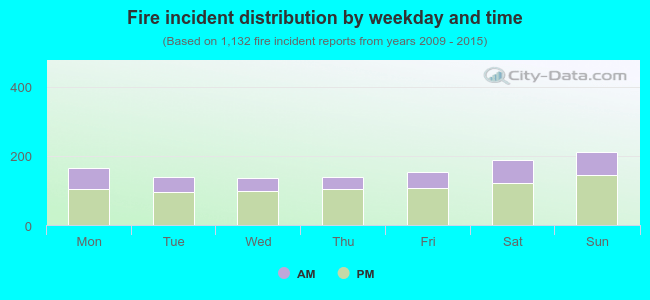 32.0% incidents where reported in the morning and 68.0% in the evening. The most fires (18.7%) took place on Sunday, and the least (12.0%) on Wednesday.
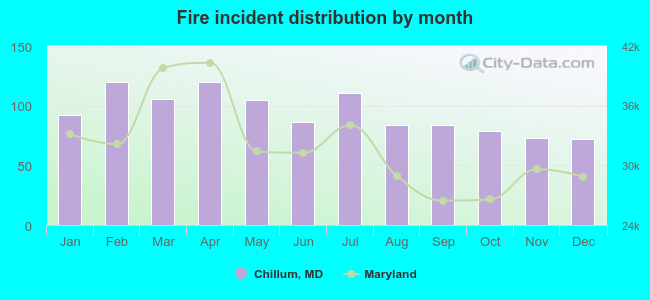 According to the 1,132 fire incidents from years 2009 - 2015 most fires (10.6%) took place during February, and the least (6.4%) in December.
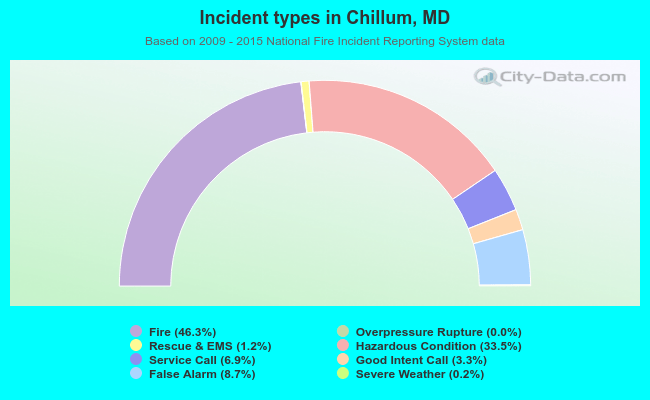 Out of all 2,447 cases reported during the years 2009 - 2015, the most belonged to the categories: Fire (46.3%), Hazardous Condition (33.5%), and False Alarm (8.7%).
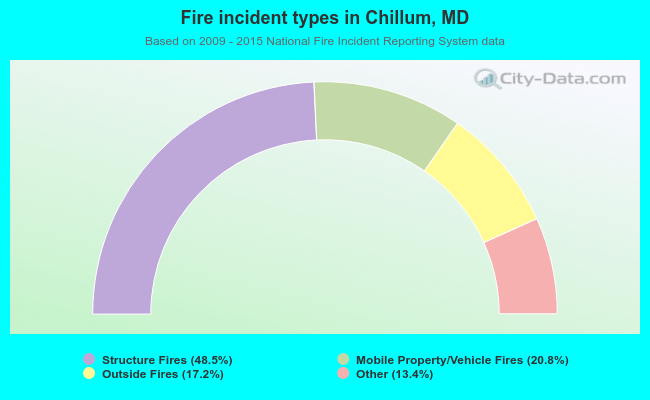 When looking into fire subcategories, the most reports belonged to: Structure Fires (48.5%), and Mobile Property/Vehicle Fires (20.8%).