Chillicothe: Fire Incidents, Missouri (MO)
Where are fire incidents reported in Chillicothe, MO
Something went wrong! Please refresh the page.
|
| |||||||||||||||||||||||||||||||||||||||||||||||||||||||||||||||||||||||||||||||||||||||||||||||||||||||||||||
| Other | 113 | |||||||||||||||||||||||||||||||||||||||||||||||||||||||||||||||||||||||||||||||||||||||||||||||||||||||||||||
2002 - 2018 National Fire Incident Reporting System (NFIRS) incidents
- Incident types reported to NFIRS in Chillicothe, MO
- 46968.1%Fire
- 13018.9%Rescue & EMS
- 7110.3%Hazardous Condition
- 60.9%Service Call
- 60.9%False Alarm
- 50.7%Good Intent Call
- 10.1%Overpressure Rupture
- 10.1%Special Incident
- Fire incident types reported to NFIRS in Chillicothe, MO
- 19240.9%Structure Fires
- 15933.9%Outside Fires
- 7516.0%Mobile Property/Vehicle Fires
- 439.2%Other
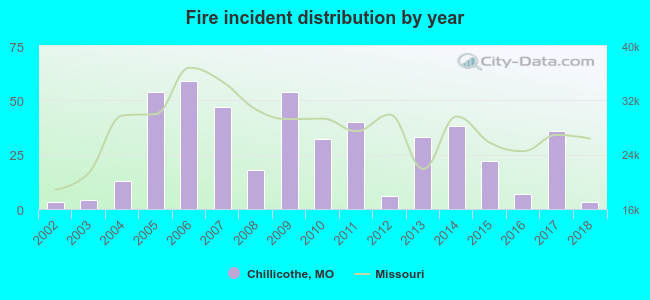 Based on the data from the years 2002 - 2018 the average number of fire incidents per year is 28. The highest number of fires - 59 took place in 2006, and the least - 3 in 2002. The data has a constant trend.
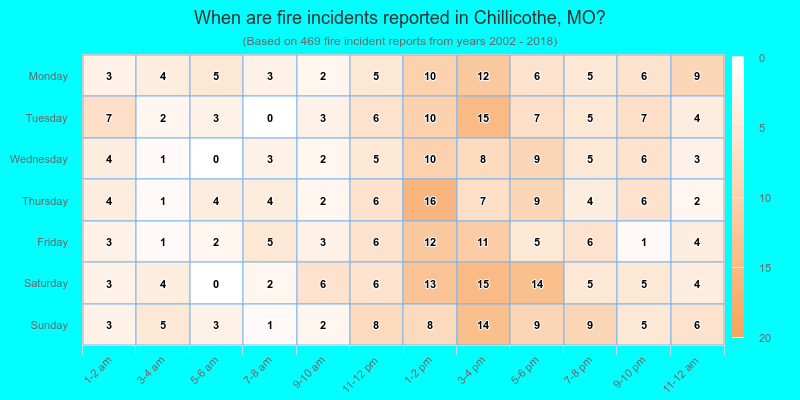
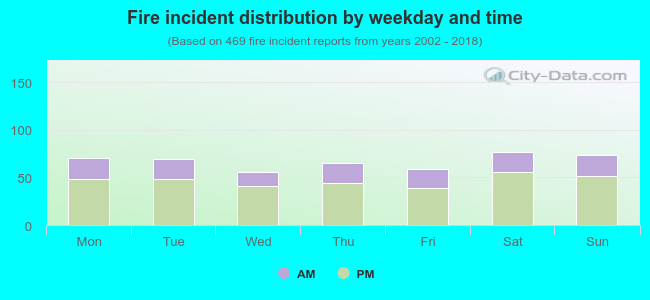 30.3% incidents where reported in the morning and 69.7% in the evening. The most fires (16.4%) took place on Saturday, and the least (11.9%) on Wednesday.
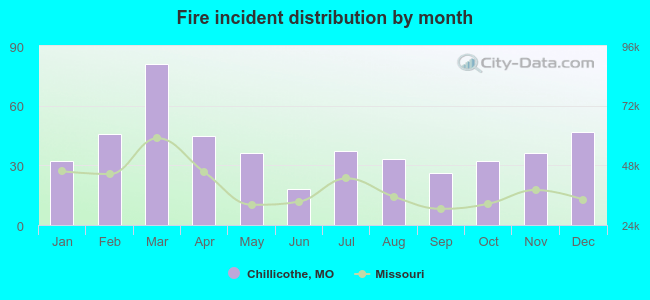 Based on the 469 incident reports from years 2002 - 2018 most fires (17.3%) took place during March, and the least (3.8%) in June.
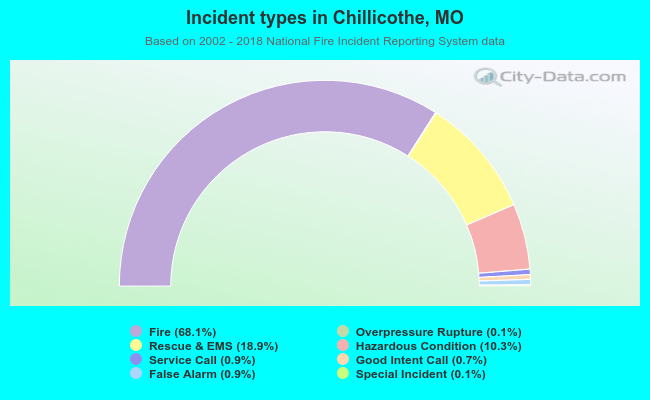 Out of all 689 cases reported during the years 2002 - 2018, the most belonged to the categories: Fire (68.1%), Rescue & EMS (18.9%), and Hazardous Condition (10.3%).
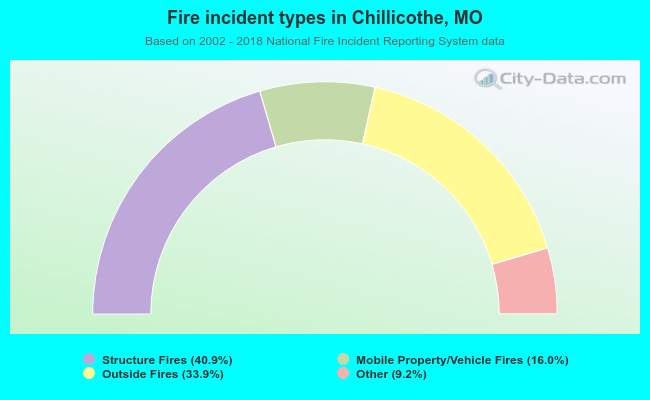 When looking into fire subcategories, the most incidents belonged to: Structure Fires (40.9%), and Outside Fires (33.9%).