Charlestown: Fire Incidents, Rhode Island (RI)
Where are fire incidents reported in Charlestown, RI
Something went wrong! Please refresh the page.
|
| |||||||||||||||||||||||||||||||||||||||||||||||||||||||||||||||||||||||||||||||||||||||||||||||||||||||||||||
2007 - 2018 National Fire Incident Reporting System (NFIRS) incidents
- Incident types reported to NFIRS in Charlestown, RI
- 32422.6%False Alarm
- 32022.3%Rescue & EMS
- 28119.6%Hazardous Condition
- 23016.0%Fire
- 15010.4%Good Intent Call
- 1299.0%Service Call
- Fire incident types reported to NFIRS in Charlestown, RI
- 11750.9%Structure Fires
- 7633.0%Outside Fires
- 2410.4%Mobile Property/Vehicle Fires
- 135.7%Other
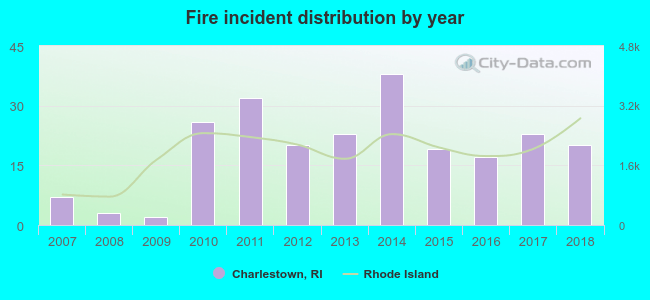 Based on the data from the years 2007 - 2018 the average number of fire incidents per year is 19. The highest number of fires - 38 took place in 2014, and the least - 2 in 2009. The data has a rising trend.
The average number of yearly fire incidents per 10k residents in Charlestown, RI compared to nearest cities:
(Note: Based on data for the last 3 years, including only cities with population 5,000 and above)
| Charlestown: | 25.6 |
| Richmond: | 11.7 |
| Hopkinton: | 4.5 |
| Westerly: | 16.4 |
| South Kingstown: | 15.7 |
| Kingston: | 35.8 |
| Narragansett: | 31.3 |
| Exeter: | 64.9 |
| West Greenwich: | 62.5 |
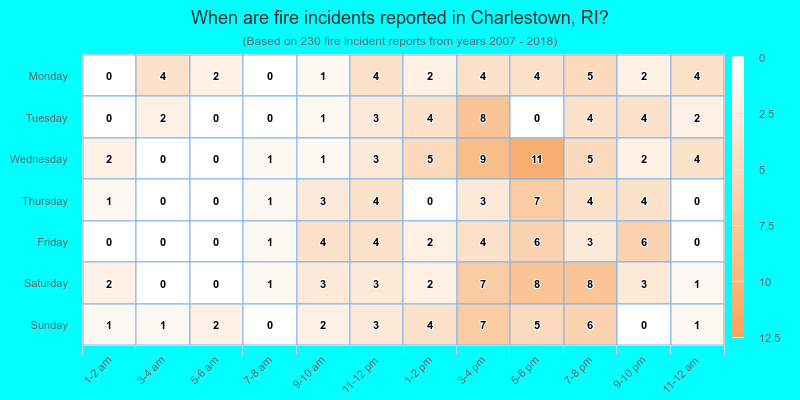
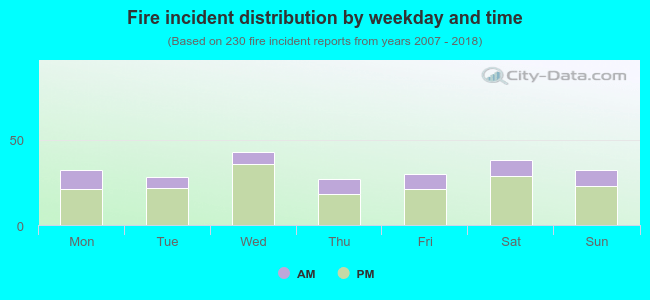 26.1% incidents where reported in the morning and 73.9% in the evening. The most fires (18.7%) took place on Wednesday, and the least (11.7%) on Thursday.
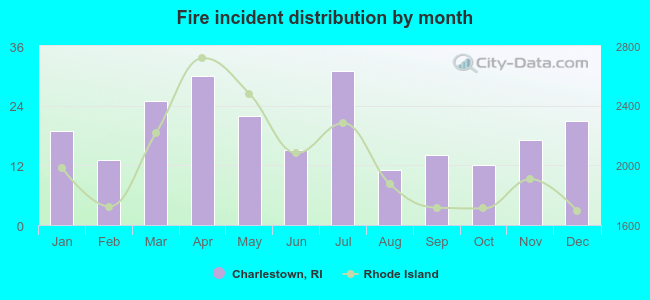 Based on the 230 fire incident reports from years 2007 - 2018 most fires (13.5%) took place during July, and the least (4.8%) in August.
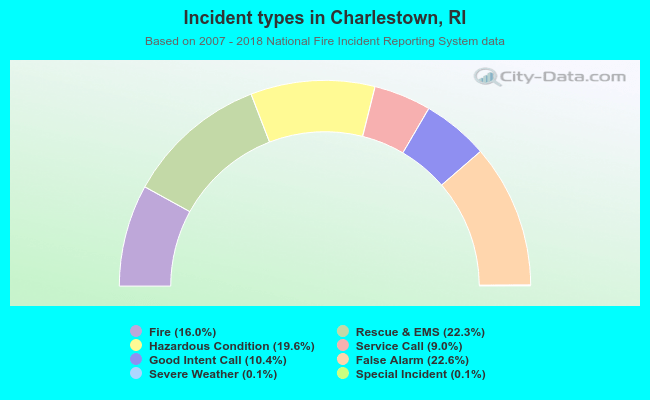 Out of all 1,436 cases reported during the years 2007 - 2018, the most belonged to the categories: Good Intent Call (22.6%), Overpressure Rupture (22.3%), and Rescue & EMS (19.6%).
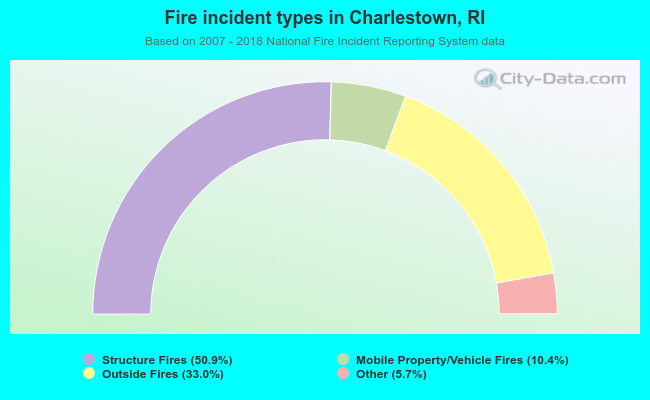 When looking into fire subcategories, the most reports belonged to: Structure Fires (50.9%), and Outside Fires (33.0%).