Charleston: Fire Incidents, Illinois (IL)
Where are fire incidents reported in Charleston, IL
Something went wrong! Please refresh the page.
| Fire incidents reported | |
|---|---|
| Sreet name | Count |
| 4TH ST | 310 |
| EIU UNIVERSITY COURT | 172 |
| 6TH ST | 118 |
| LINCOLN AVE | 114 |
| POLK AVE | 98 |
| 18TH ST | 86 |
| 9TH ST | 84 |
| 10TH ST | 80 |
| UNIVERSITY COURT | 80 |
| MADISON AVE | 78 |
| DIVISION ST | 74 |
| 12TH ST | 72 |
| 11TH ST | 66 |
| 7TH ST | 60 |
| EDGAR DR | 56 |
| REYNOLDS DR | 54 |
| EIU GREEK CT | 50 |
| EIU ANDREWS HALL | 46 |
| 5TH ST | 42 |
| LINCOLN | 42 |
| STATE ST | 40 |
| 2ND ST | 38 |
| 3RD ST | 38 |
| GRANT ST | 38 |
| EIU LAWSON HALL | 36 |
| EIU WELLER HALL | 36 |
| GREEK COURT CT | 36 |
| POLK ST | 32 |
| C ST | 30 |
| EIU MCKINNEY HALL | 30 |
| Other | 114 |
2002 - 2018 National Fire Incident Reporting System (NFIRS) incidents
- Incident types reported to NFIRS in Charleston, IL
- 13,46568.1%Rescue & EMS
- 2,25011.4%Fire
- 1,2406.3%Service Call
- 1,1365.7%False Alarm
- 9124.6%Hazardous Condition
- 7343.7%Good Intent Call
- 210.1%Overpressure Rupture
- 210.1%Special Incident
- Fire incident types reported to NFIRS in Charleston, IL
- 1,17252.1%Structure Fires
- 84237.4%Outside Fires
- 2079.2%Mobile Property/Vehicle Fires
- 291.3%Other
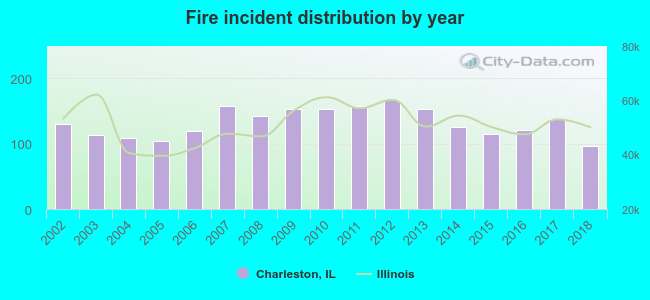 According to the data from the years 2002 - 2018 the average number of fire incidents per year is 132. The highest number of fire incidents - 166 took place in 2012, and the least - 97 in 2018. The data has a dropping trend.
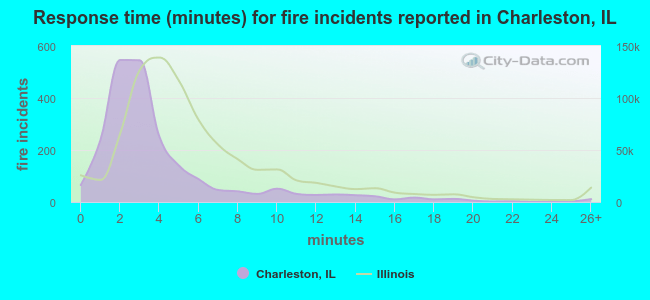 The median response time based on all reported fire incidents is 3 minutes. This is lower compared to the Illinois median value.
The median response time in Charleston, IL compared to nearest cities:
(Note: Based on data for all years, including only cities with at least 500 fire incidents)
| Charleston: | 3 minutes |
| Mattoon: | 4 minutes |
| Sullivan: | 7 minutes |
| Marshall: | 9 minutes |
| Paris: | 6 minutes |
| Effingham: | 4 minutes |
| Shelbyville: | 6 minutes |
| Newton: | 7 minutes |
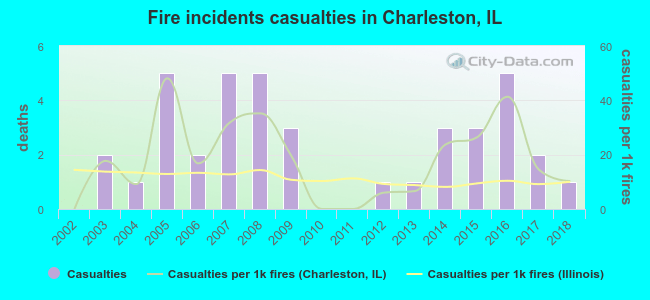 Based on the data from the years 2002 - 2018 the average number of fire-related yearly casualties is 2. The highest number of casualties - 5 took place in 2005, and the lowest - 0 in 2002. The data has an increasing trend.
The average number of injuries per 1,000 fire incidents is 18. This indicator was the highest - 48 in 2005, and the lowest 0 in 2002. The trend for casualties per 1,000 incidents is growing. Compared to the state value the number of casualties per 1,000 incidents is higher.
Based on the data from the years 2002 - 2018 the average number of fire-related yearly casualties is 2. The highest number of casualties - 5 took place in 2005, and the lowest - 0 in 2002. The data has an increasing trend.
The average number of injuries per 1,000 fire incidents is 18. This indicator was the highest - 48 in 2005, and the lowest 0 in 2002. The trend for casualties per 1,000 incidents is growing. Compared to the state value the number of casualties per 1,000 incidents is higher.
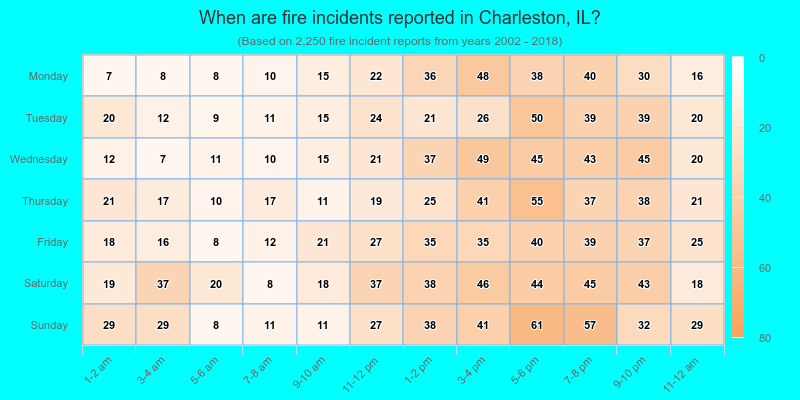
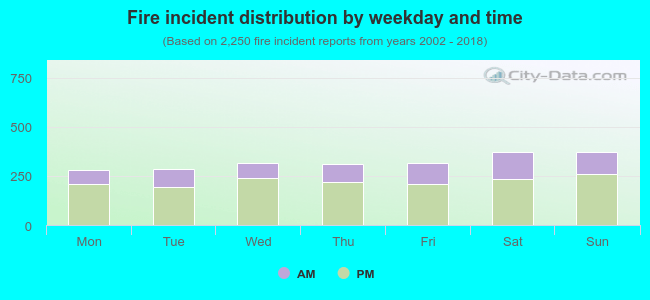 30.6% incidents where reported in the morning and 69.4% in the evening. The most fires (16.6%) took place on Saturday, and the least (12.4%) on Monday.
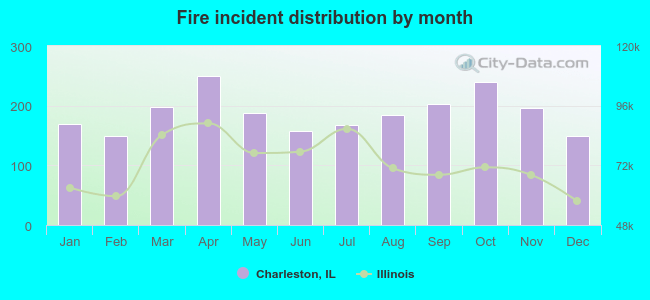 According to the 2,250 fires from years 2002 - 2018 most fires (11.1%) took place during April, and the least (6.7%) in February.
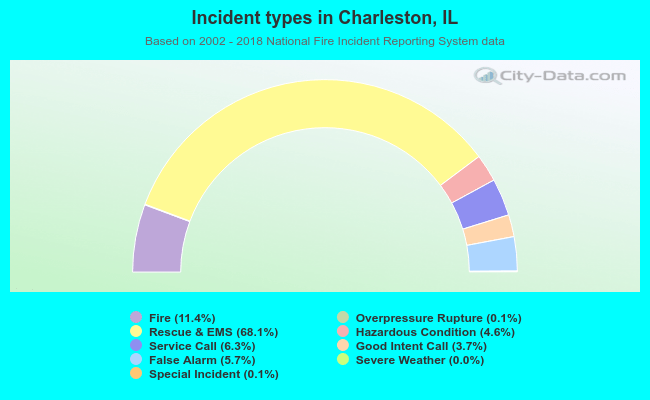 Out of all 19,784 cases reported during the years 2002 - 2018, the most belonged to the categories: Rescue & EMS (68.1%), Fire (11.4%), and Service Call (6.3%).
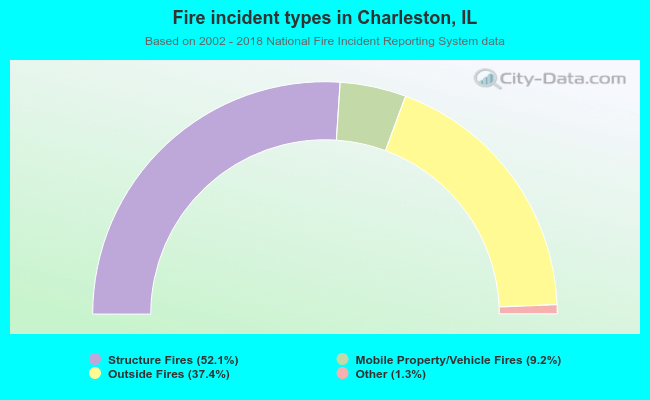 When looking into fire subcategories, the most incidents belonged to: Structure Fires (52.1%), and Outside Fires (37.4%).