Chanute: Fire Incidents, Kansas (KS)
Where are fire incidents reported in Chanute, KS
Something went wrong! Please refresh the page.
| Fire incidents reported | |
|---|---|
| Sreet name | Count |
| SANTA FE AVE | 92 |
| MAIN ST | 60 |
| SANTA FE | 60 |
| HARPER RD | 48 |
| CENTRAL AVE | 46 |
| EVERGREEN | 44 |
| GRANT AVE | 44 |
| 14TH ST | 42 |
| HIGHLAND AVE | 42 |
| MAIN | 40 |
| PLUMMER | 40 |
| MALCOLM AVE | 36 |
| PLUMMER AVE | 36 |
| WASHINGTON AVE | 36 |
| 39 HWY | 32 |
| KANSAS AVE | 32 |
| HIGHLAND | 30 |
| 220TH RD | 28 |
| GARFIELD AVE | 28 |
| EVERGREEN AVE | 26 |
| FOREST AVE | 24 |
| DOUGLAS RD | 22 |
| HIGHWAY 39 HWY | 22 |
| IRVING RD | 22 |
| LINCOLN AVE | 22 |
| STEUBEN AVE | 22 |
| 160TH RD | 20 |
| ALLEN AVE | 20 |
| 170TH RD | 18 |
| CENTRAL | 18 |
| Other | 385 |
2002 - 2018 National Fire Incident Reporting System (NFIRS) incidents
- Incident types reported to NFIRS in Chanute, KS
- 3,15538.2%Rescue & EMS
- 2,26427.4%Hazardous Condition
- 1,43717.4%Fire
- 6087.4%Good Intent Call
- 4685.7%Service Call
- 3073.7%False Alarm
- 120.1%Overpressure Rupture
- 100.1%Severe Weather
- Fire incident types reported to NFIRS in Chanute, KS
- 75652.6%Outside Fires
- 41228.7%Structure Fires
- 22015.3%Mobile Property/Vehicle Fires
- 493.4%Other
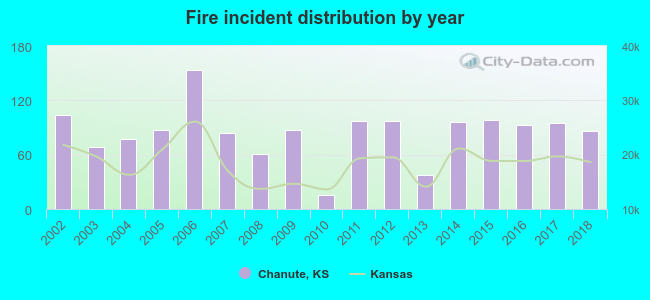 According to the data from the years 2002 - 2018 the average number of fire incidents per year is 85. The highest number of fires - 154 took place in 2006, and the least - 16 in 2010. The data has a dropping trend.
The average number of yearly fire incidents per 10k residents in Chanute, KS compared to nearest cities:
(Note: Based on data for the last 3 years, including only cities with population 5,000 and above)
| Chanute: | 98.3 |
| Iola: | 111.7 |
| Parsons: | 91.1 |
| Independence: | 132.4 |
| Fort Scott: | 218.9 |
| Coffeyville: | 129.3 |
| Pittsburg: | 99.9 |
 The median response time based on all reported fire incidents is 6 minutes. This is similar to the state median value.
The median response time in Chanute, KS compared to nearest cities:
(Note: Based on data for all years, including only cities with at least 500 fire incidents)
| Chanute: | 6 minutes |
| Iola: | 6 minutes |
| Yates Center: | 10 minutes |
| Neodesha: | 5 minutes |
| Parsons: | 6 minutes |
| Cherryvale: | 7 minutes |
| Independence: | 5 minutes |
| Burlington: | 10 minutes |
| Fort Scott: | 7 minutes |
 According to the data from the years 2002 - 2018 the average number of fire-related fatalities per year is 0. The highest number of deaths - 1 took place in 2004, and the lowest - 0 in 2002. The data has a constant trend.
 According to the data from the years 2002 - 2018 the average number of fire-related yearly casualties is 1. The highest number of reported casualties - 4 took place in 2005, and the lowest - 0 in 2002. The data has a constant trend.
The average number of casualties per 1,000 fire incidents is 15. This indicator was the highest - 108 in 2013, and the lowest 0 in 2002. The trend for injuries per 1,000 incidents is constant. Compared to the state value the number of casualties per 1,000 fires is higher.
According to the data from the years 2002 - 2018 the average number of fire-related yearly casualties is 1. The highest number of reported casualties - 4 took place in 2005, and the lowest - 0 in 2002. The data has a constant trend.
The average number of casualties per 1,000 fire incidents is 15. This indicator was the highest - 108 in 2013, and the lowest 0 in 2002. The trend for injuries per 1,000 incidents is constant. Compared to the state value the number of casualties per 1,000 fires is higher.Casualties per 1,000 incidents in Chanute, KS compared to nearest cities:
(Note: Based on data for all years, including only cities with at least 500 fire incidents)
| Chanute: | 11.8 |
| Iola: | 6.6 |
| Yates Center: | 0.0 |
| Neodesha: | 12.3 |
| Parsons: | 9.1 |
| Cherryvale: | 3.5 |
| Independence: | 15.4 |
| Burlington: | 1.6 |
| Fort Scott: | 3.7 |
 28.0% incidents where reported in the morning and 72.0% in the evening. The most fires (15.8%) took place on Saturday, and the least (12.9%) on Thursday.
 Based on the 1,437 fire incidents from years 2002 - 2018 most fires (16.1%) took place during March, and the least (4.0%) in May.
 Out of all 8,263 cases reported during the years 2002 - 2018, the most belonged to the categories: Rescue & EMS (38.2%), Hazardous Condition (27.4%), and Fire (17.4%).
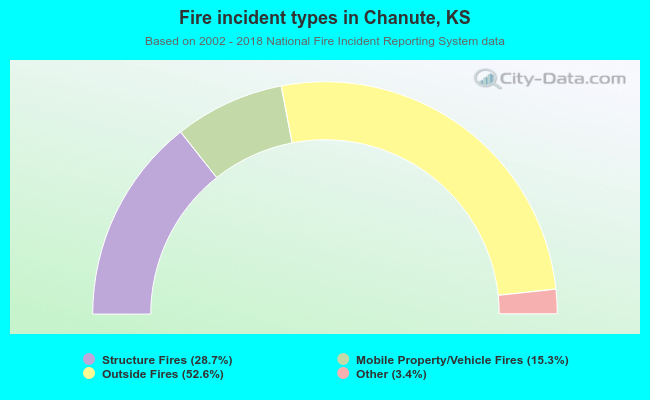 When looking into fire subcategories, the most reports belonged to: Outside Fires (52.6%), and Structure Fires (28.7%).