Calexico: Fire Incidents, California (CA)
Where are fire incidents reported in Calexico, CA
Something went wrong! Please refresh the page.
|
| |||||||||||||||||||||||||||||||||||||||||||||||||||||||||||||||||||||||||||||||||||||||||||||||||||||||||||||
2005 - 2018 National Fire Incident Reporting System (NFIRS) incidents
- Incident types reported to NFIRS in Calexico, CA
- 8,48677.8%Rescue & EMS
- 7857.2%Fire
- 6956.4%Good Intent Call
- 4584.2%Service Call
- 3102.8%False Alarm
- 1611.5%Hazardous Condition
- Fire incident types reported to NFIRS in Calexico, CA
- 37147.3%Outside Fires
- 21126.9%Structure Fires
- 14118.0%Mobile Property/Vehicle Fires
- 627.9%Other
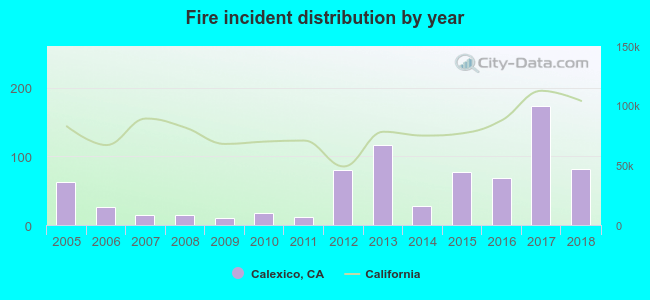 According to the data from the years 2005 - 2018 the average number of fires per year is 56. The highest number of fire incidents - 174 took place in 2017, and the least - 10 in 2009. The data has a rising trend.
The average number of yearly fire incidents per 10k residents in Calexico, CA compared to nearest cities:
(Note: Based on data for the last 3 years, including only cities with population 5,000 and above)
| Calexico: | 27.1 |
| El Centro: | 51.5 |
| Holtville: | 75.3 |
| Imperial: | 22.6 |
| Brawley: | 21.6 |
| Calipatria: | 4.4 |
| Oasis: | 1.5 |
| Mecca: | 3.5 |
| Alpine: | 48.0 |
 The median response time based on all reported fire incidents is 5 minutes. This is lower than the state median value.
The median response time in Calexico, CA compared to nearest cities:
(Note: Based on data for all years, including only cities with at least 500 fire incidents)
| Calexico: | 5 minutes |
| El Centro: | 5 minutes |
| Holtville: | 11 minutes |
| Imperial: | 6 minutes |
| Yuma: | 6 minutes |
| Alpine: | 9 minutes |
| Lakeside: | 8 minutes |
| Ramona: | 5 minutes |
| El Cajon: | 6 minutes |
 35.2% incidents where reported in the morning and 64.8% in the evening. The most fires (16.1%) took place on Thursday, and the least (12.0%) on Sunday.
 According to the 785 fire incident reports from years 2005 - 2018 most fires (12.7%) took place during June, and the least (5.4%) in November.
 Out of all 10,905 cases reported during the years 2005 - 2018, the most belonged to the categories: Rescue & EMS (77.8%), Fire (7.2%), and Good Intent Call (6.4%).
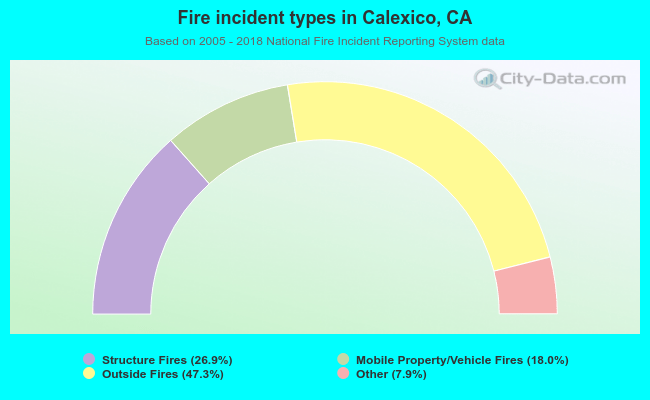 When looking into fire subcategories, the most incidents belonged to: Outside Fires (47.3%), and Structure Fires (26.9%).