Cabot: Fire Incidents, Arkansas (AR)
Where are fire incidents reported in Cabot, AR
Something went wrong! Please refresh the page.
| Fire incidents reported | |
|---|---|
| Sreet name | Count |
| 2ND ST | 186 |
| MAIN ST | 124 |
| HWY 5 | 108 |
| ARKANSAS 5 HWY | 84 |
| MOUNTAIN SPRINGS RD | 80 |
| PINE ST | 78 |
| JUSTICE RD | 74 |
| HWY 107 | 64 |
| PETERS RD | 62 |
| KERR STATION RD | 60 |
| 1ST ST | 50 |
| CLELAND RD | 50 |
| BALLARD RD | 48 |
| HWY 67167 | 44 |
| 67/167 HWY | 42 |
| ARNIES VALLEY RD | 42 |
| HWY 89 | 38 |
| LOCUST ST | 38 |
| CAMPGROUND RD | 36 |
| PHEASANT RUN DR | 36 |
| WILLIE RAY DR | 36 |
| MT. SPRINGS RD | 34 |
| LINCOLN ST | 32 |
| RODERWEIS RD | 32 |
| CENTENNIAL RD | 28 |
| BILL FOSTER MEMORIAL HWY | 26 |
| JACKSON ST | 26 |
| PRIDE GAP RD | 26 |
| SPRING VALLEY RD | 26 |
| SUNSET CIR | 26 |
| Other | 1,216 |
2002 - 2018 National Fire Incident Reporting System (NFIRS) incidents
- Incident types reported to NFIRS in Cabot, AR
- 12,43862.6%Rescue & EMS
- 2,85214.4%Fire
- 1,7048.6%Good Intent Call
- 1,2916.5%Service Call
- 8354.2%Hazardous Condition
- 6913.5%False Alarm
- 380.2%Severe Weather
- Fire incident types reported to NFIRS in Cabot, AR
- 1,53053.6%Outside Fires
- 86530.3%Structure Fires
- 39113.7%Mobile Property/Vehicle Fires
- 662.3%Other
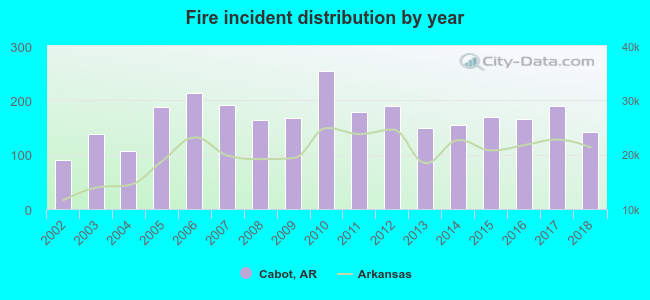 Based on the data from the years 2002 - 2018 the average number of fire incidents per year is 168. The highest number of fire incidents - 254 took place in 2010, and the least - 90 in 2002. The data has a rising trend.
The average number of yearly fire incidents per 10k residents in Cabot, AR compared to nearest cities:
(Note: Based on data for the last 3 years, including only cities with population 5,000 and above)
| Cabot: | 64.8 |
| Jacksonville: | 71.7 |
| Beebe: | 171.0 |
| Sherwood: | 68.3 |
| North Little Rock: | 87.9 |
| Maumelle: | 23.6 |
| Little Rock: | 80.1 |
| Searcy: | 91.0 |
| Conway: | 51.4 |
 The median response time based on all reported fire incidents is 6 minutes. This is close to the Arkansas median value.
The median response time in Cabot, AR compared to nearest cities:
(Note: Based on data for all years, including only cities with at least 500 fire incidents)
| Cabot: | 6 minutes |
| Austin: | 7 minutes |
| Ward: | 7 minutes |
| Jacksonville: | 5 minutes |
| Beebe: | 5 minutes |
| Vilonia: | 6 minutes |
| Sherwood: | 4 minutes |
| Lonoke: | 9 minutes |
| McRae: | 8 minutes |
 Based on the data from the years 2002 - 2018 the average number of fire-related yearly deaths is 0. The highest number of deaths - 1 took place in 2008, and the lowest - 0 in 2002. The data has a constant trend.
The average number of deaths per 1,000 fires is 1. This indicator was the highest - 6 in 2008, and the lowest 0 in 2002. The trend for fatalities per 1,000 fire incidents is constant. Compared to the Arkansas value the number of fatalities per 1,000 fire incidents is much lower.
Based on the data from the years 2002 - 2018 the average number of fire-related yearly deaths is 0. The highest number of deaths - 1 took place in 2008, and the lowest - 0 in 2002. The data has a constant trend.
The average number of deaths per 1,000 fires is 1. This indicator was the highest - 6 in 2008, and the lowest 0 in 2002. The trend for fatalities per 1,000 fire incidents is constant. Compared to the Arkansas value the number of fatalities per 1,000 fire incidents is much lower.Deaths per 1,000 incidents in Cabot, AR compared to nearest cities:
(Note: Based on data for all years, including only cities with at least 2,500 fire incidents)
| Cabot: | 1.1 |
| Jacksonville: | 1.6 |
| Sherwood: | 0.7 |
| North Little Rock: | 2.3 |
| Little Rock: | 1.4 |
| Searcy: | 1.0 |
| Conway: | 2.7 |
| Benton: | 1.2 |
 27.5% incidents where reported in the morning and 72.5% in the evening. The most fires (16.8%) took place on Saturday, and the least (12.7%) on Thursday.
 Based on the 2,852 fire incidents from years 2002 - 2018 most fires (12.4%) took place during March, and the least (5.7%) in May.
 Out of all 19,868 cases reported during the years 2002 - 2018, the most belonged to the categories: Rescue & EMS (62.6%), Fire (14.4%), and Good Intent Call (8.6%).
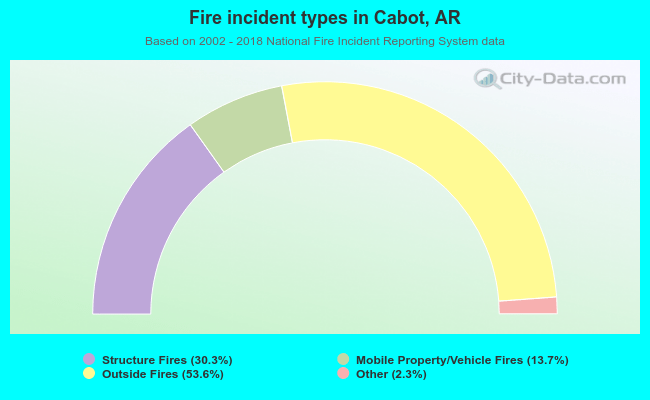 When looking into fire subcategories, the most reports belonged to: Outside Fires (53.6%), and Structure Fires (30.3%).