Burlington: Fire Incidents, Vermont (VT)
Where are fire incidents reported in Burlington, VT
Something went wrong! Please refresh the page.
| Fire incidents reported | |
|---|---|
| Sreet name | Count |
| MAIN ST | 318 |
| COLCHESTER AVE | 288 |
| PROSPECT ST | 256 |
| NORTH AVE | 250 |
| COLLEGE ST | 236 |
| PEARL ST | 232 |
| WINOOSKI AVE | 224 |
| WILLARD ST | 218 |
| CHURCH ST | 202 |
| PINE ST | 180 |
| NORTH ST | 152 |
| CHAMPLAIN ST | 142 |
| RIVERSIDE AVE | 120 |
| ST PAUL ST | 118 |
| UNION ST | 116 |
| CHERRY ST | 90 |
| MAPLE ST | 86 |
| ELMWOOD AVE | 74 |
| NORTHSHORE DR | 70 |
| ARCHIBALD ST | 66 |
| BUELL ST | 64 |
| KING ST | 64 |
| LAKE ST | 60 |
| SPEAR ST | 58 |
| NORTHGATE RD | 56 |
| INTERVALE AVE | 54 |
| FLYNN AVE | 52 |
| MANHATTAN DR | 52 |
| WILLIAMS ST | 50 |
| SHELBURNE RD | 48 |
2002 - 2018 National Fire Incident Reporting System (NFIRS) incidents
- Incident types reported to NFIRS in Burlington, VT
- 25,45556.8%Rescue & EMS
- 5,99013.4%False Alarm
- 3,6998.3%Good Intent Call
- 3,3297.4%Service Call
- 3,1707.1%Fire
- 2,9156.5%Hazardous Condition
- 1570.4%Special Incident
- Fire incident types reported to NFIRS in Burlington, VT
- 1,84158.1%Structure Fires
- 1,05433.2%Outside Fires
- 2086.6%Mobile Property/Vehicle Fires
- 672.1%Other
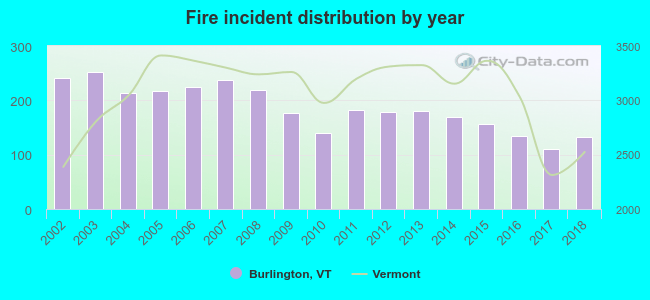 According to the data from the years 2002 - 2018 the average number of fires per year is 186. The highest number of fire incidents - 252 took place in 2003, and the least - 110 in 2017. The data has a decreasing trend.
The average number of yearly fire incidents per 10k residents in Burlington, VT compared to nearest cities:
(Note: Based on data for the last 3 years, including only cities with population 5,000 and above)
| Burlington: | 29.8 |
| Winooski: | 101.5 |
| South Burlington: | 33.6 |
| Colchester: | 28.9 |
| Essex Junction: | 59.0 |
| Essex: | 1.4 |
| Shelburne: | 38.3 |
| Williston: | 36.8 |
 The median response time based on all reported fire incidents is 3 minutes. This is much lower compared to the Vermont median value.
The median response time in Burlington, VT compared to nearest cities:
(Note: Based on data for all years, including only cities with at least 500 fire incidents)
| Burlington: | 3 minutes |
| Winooski: | 5 minutes |
| South Burlington: | 4 minutes |
| Colchester: | 7 minutes |
| Essex Junction: | 7 minutes |
| Williston: | 5 minutes |
| Milton: | 9 minutes |
| Plattsburgh: | 6 minutes |
 Based on the data from the years 2002 - 2018 the average number of fire-related yearly deaths is 0. The highest number of reported deaths - 1 took place in 2006, and the lowest - 0 in 2002. The data has a constant trend.
The average number of fatalities per 1,000 fire incidents is 1. This indicator was the highest - 6 in 2012, and the lowest 0 in 2002. The trend for deaths per 1,000 incidents is constant. Compared to the Vermont value the number of fatalities per 1,000 fire incidents is lower.
Based on the data from the years 2002 - 2018 the average number of fire-related yearly deaths is 0. The highest number of reported deaths - 1 took place in 2006, and the lowest - 0 in 2002. The data has a constant trend.
The average number of fatalities per 1,000 fire incidents is 1. This indicator was the highest - 6 in 2012, and the lowest 0 in 2002. The trend for deaths per 1,000 incidents is constant. Compared to the Vermont value the number of fatalities per 1,000 fire incidents is lower.Deaths per 1,000 incidents in Burlington, VT compared to nearest cities:
(Note: Based on data for all years, including only cities with at least 2,500 fire incidents)
| Burlington: | 0.9 |
 Based on the data from the years 2002 - 2018 the average number of fire-related yearly casualties is 5. The highest number of casualties - 11 took place in 2004, and the lowest - 1 in 2007. The data has a rising trend.
The average number of injuries per 1,000 fire incidents is 27. This indicator was the highest - 75 in 2018, and the lowest 4 in 2007. The trend for injuries per 1,000 fire incidents is growing. Compared to the state value the number of casualties per 1,000 fire incidents is much higher.
Based on the data from the years 2002 - 2018 the average number of fire-related yearly casualties is 5. The highest number of casualties - 11 took place in 2004, and the lowest - 1 in 2007. The data has a rising trend.
The average number of injuries per 1,000 fire incidents is 27. This indicator was the highest - 75 in 2018, and the lowest 4 in 2007. The trend for injuries per 1,000 fire incidents is growing. Compared to the state value the number of casualties per 1,000 fire incidents is much higher.Casualties per 1,000 incidents in Burlington, VT compared to nearest cities:
(Note: Based on data for all years, including only cities with at least 500 fire incidents)
| Burlington: | 25.2 |
| Winooski: | 1.0 |
| South Burlington: | 6.1 |
| Colchester: | 3.2 |
| Essex Junction: | 5.2 |
| Williston: | 0.0 |
| Milton: | 19.3 |
| Plattsburgh: | 10.5 |
 33.8% incidents where reported in the morning and 66.2% in the evening. The most fires (16.2%) took place on Sunday, and the least (13.1%) on Tuesday.
 Based on the 3,170 incident reports from years 2002 - 2018 most fires (11.9%) took place during May, and the least (6.2%) in January.
 Out of all 44,777 cases reported during the years 2002 - 2018, the most belonged to the categories: Rescue & EMS (56.8%), False Alarm (13.4%), and Good Intent Call (8.3%).
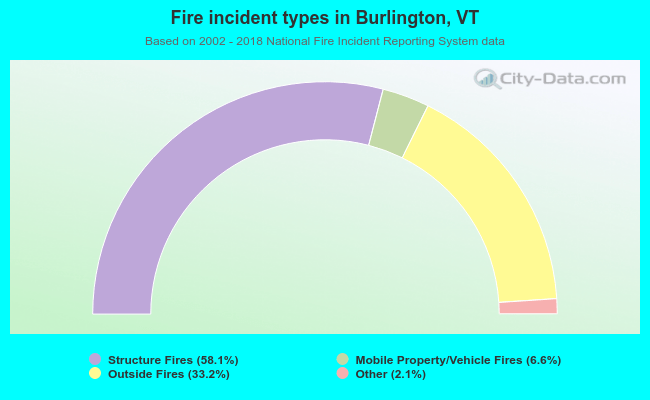 When looking into fire subcategories, the most reports belonged to: Structure Fires (58.1%), and Outside Fires (33.2%).