Brea: Fire Incidents, California (CA)
Where are fire incidents reported in Brea, CA
Something went wrong! Please refresh the page.
|
| |||||||||||||||||||||||||||||||||||||||||||||||||||||||||||||||||||||||||||||||||||||||||||||||||||||||||||||
2005 - 2018 National Fire Incident Reporting System (NFIRS) incidents
- Incident types reported to NFIRS in Brea, CA
- 8,03466.4%Rescue & EMS
- 2,00516.6%Good Intent Call
- 8827.3%Service Call
- 5234.3%False Alarm
- 3282.7%Hazardous Condition
- 2612.2%Fire
- 370.3%Special Incident
- 260.2%Severe Weather
- Fire incident types reported to NFIRS in Brea, CA
- 9436.0%Structure Fires
- 8432.2%Outside Fires
- 5721.8%Mobile Property/Vehicle Fires
- 2610.0%Other
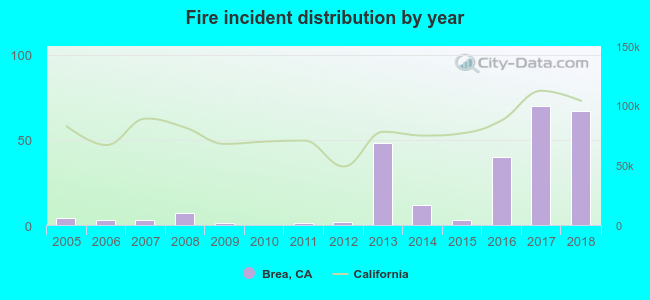 Based on the data from the years 2005 - 2018 the average number of fires per year is 19. The highest number of reported fires - 70 took place in 2017, and the least - 0 in 2010. The data has an increasing trend.
The average number of yearly fire incidents per 10k residents in Brea, CA compared to nearest cities:
(Note: Based on data for the last 3 years, including only cities with population 5,000 and above)
| Brea: | 14.2 |
| Placentia: | 8.7 |
| La Habra: | 10.7 |
| Fullerton: | 9.2 |
| Rowland Heights: | 6.5 |
| La Habra Heights: | 18.9 |
| Anaheim: | 11.0 |
| Yorba Linda: | 6.8 |
| Diamond Bar: | 9.5 |

 34.5% incidents where reported in the morning and 65.5% in the evening. The most fires (16.5%) took place on Thursday, and the least (11.5%) on Friday.
 Based on the 261 fire incident reports from years 2005 - 2018 most fires (14.2%) took place during July, and the least (5.0%) in February.
 Out of all 12,105 cases reported during the years 2005 - 2018, the most belonged to the categories: Rescue & EMS (66.4%), Good Intent Call (16.6%), and Service Call (7.3%).
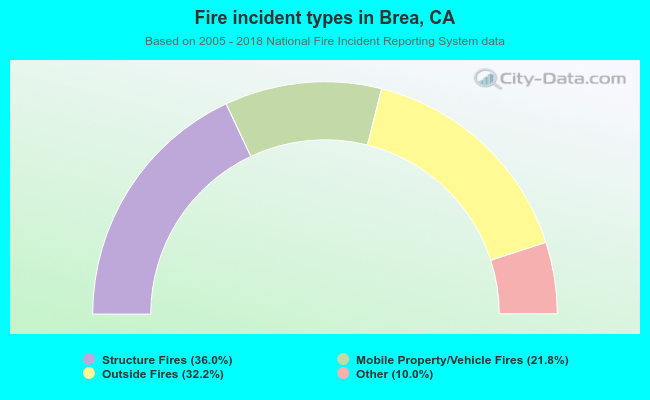 When looking into fire subcategories, the most reports belonged to: Structure Fires (36.0%), and Outside Fires (32.2%).