Bradenton: Fire Incidents, Florida (FL)
Where are fire incidents reported in Bradenton, FL
Something went wrong! Please refresh the page.
| Fire incidents reported | |
|---|---|
| Sreet name | Count |
| 14 ST | 862 |
| MANATEE AVE | 608 |
| CORTEZ RD | 556 |
| 26 ST | 386 |
| 53 AVE | 376 |
| 15 ST | 344 |
| SR64 | 226 |
| 14TH ST | 220 |
| 9 ST | 200 |
| 301 BLVD | 194 |
| 44 AVE | 178 |
| 1 ST | 174 |
| 30 AVE | 168 |
| 5 ST | 162 |
| 63 AVE | 148 |
| MANATEE AVE AVE | 148 |
| SR 64 | 144 |
| SR70 | 144 |
| 9TH ST | 142 |
| 18 ST | 136 |
| 34 ST | 136 |
| 19 ST | 132 |
| I75 SB | 130 |
| 26 AVE | 126 |
| 57 AVE | 126 |
| 15TH ST | 124 |
| 51 AVE | 118 |
| 20 ST | 114 |
| 32 AVE | 110 |
| 51ST ST | 108 |
| Other | 5,284 |
2002 - 2018 National Fire Incident Reporting System (NFIRS) incidents
- Incident types reported to NFIRS in Bradenton, FL
- 70,82759.4%Rescue & EMS
- 12,02410.1%Fire
- 11,7839.9%Hazardous Condition
- 11,3249.5%False Alarm
- 9,1877.7%Good Intent Call
- 3,6433.1%Service Call
- 2030.2%Special Incident
- 2020.2%Overpressure Rupture
- Fire incident types reported to NFIRS in Bradenton, FL
- 4,85840.4%Outside Fires
- 3,80231.6%Structure Fires
- 2,10817.5%Mobile Property/Vehicle Fires
- 1,25610.4%Other
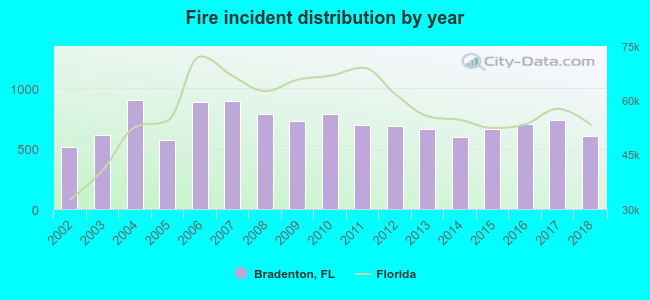 Based on the data from the years 2002 - 2018 the average number of fire incidents per year is 707. The highest number of fire incidents - 900 took place in 2004, and the least - 512 in 2002. The data has a rising trend.
The average number of yearly fire incidents per 10k residents in Bradenton, FL compared to nearest cities:
(Note: Based on data for the last 3 years, including only cities with population 5,000 and above)
| Bradenton: | 129.0 |
| Palmetto: | 59.1 |
| Longboat Key: | 47.6 |
| Sarasota: | 56.6 |
| Myakka: | 0.9 |
| Parrish: | 46.8 |
| Ruskin: | 20.0 |
| Gulfport: | 23.5 |
| South Pasadena: | 29.1 |
 The median response time based on all reported fire incidents is 5 minutes. This is lower compared to the state median value.
The median response time in Bradenton, FL compared to nearest cities:
(Note: Based on data for all years, including only cities with at least 500 fire incidents)
| Bradenton: | 5 minutes |
| Palmetto: | 6 minutes |
| Sarasota: | 6 minutes |
| Parrish: | 6 minutes |
| Ruskin: | 10 minutes |
| Gulfport: | 5 minutes |
| St. Petersburg: | 4 minutes |
| Lealman: | 5 minutes |
| Pinellas Park: | 5 minutes |
 Based on the data from the years 2002 - 2018 the average number of fire-related yearly deaths is 1. The highest number of reported deaths - 4 took place in 2017, and the lowest - 0 in 2002. The data has a constant trend.
The average number of deaths per 1,000 fire incidents is 1. This indicator was the highest - 5 in 2017, and the lowest 0 in 2002. The trend for fatalities per 1,000 fire incidents is constant. Compared to the state value the number of deaths per 1,000 incidents is lower.
Based on the data from the years 2002 - 2018 the average number of fire-related yearly deaths is 1. The highest number of reported deaths - 4 took place in 2017, and the lowest - 0 in 2002. The data has a constant trend.
The average number of deaths per 1,000 fire incidents is 1. This indicator was the highest - 5 in 2017, and the lowest 0 in 2002. The trend for fatalities per 1,000 fire incidents is constant. Compared to the state value the number of deaths per 1,000 incidents is lower.Deaths per 1,000 incidents in Bradenton, FL compared to nearest cities:
(Note: Based on data for all years, including only cities with at least 2,500 fire incidents)
| Bradenton: | 1.1 |
| Sarasota: | 0.8 |
| St. Petersburg: | 0.9 |
| Pinellas Park: | 2.3 |
| Largo: | 2.0 |
 Based on the reports from the years 2002 - 2018 the average number of fire-related yearly casualties is 4. The highest number of reported injuries - 10 took place in 2007, and the lowest - 1 in 2008. The data has a growing trend.
The average number of injuries per 1,000 fires is 6. This indicator was the highest - 12 in 2018, and the lowest 1 in 2008. The trend for injuries per 1,000 fires is rising. Compared to the state value the number of injuries per 1,000 incidents is lower.
Based on the reports from the years 2002 - 2018 the average number of fire-related yearly casualties is 4. The highest number of reported injuries - 10 took place in 2007, and the lowest - 1 in 2008. The data has a growing trend.
The average number of injuries per 1,000 fires is 6. This indicator was the highest - 12 in 2018, and the lowest 1 in 2008. The trend for injuries per 1,000 fires is rising. Compared to the state value the number of injuries per 1,000 incidents is lower.Casualties per 1,000 incidents in Bradenton, FL compared to nearest cities:
(Note: Based on data for all years, including only cities with at least 500 fire incidents)
| Bradenton: | 6.2 |
| Palmetto: | 9.1 |
| Sarasota: | 6.5 |
| Parrish: | 4.6 |
| Ruskin: | 29.8 |
| Gulfport: | 24.2 |
| St. Petersburg: | 24.4 |
| Lealman: | 48.5 |
| Pinellas Park: | 48.9 |
 30.6% incidents where reported in the morning and 69.4% in the evening. The most fires (15.2%) took place on Saturday, and the least (13.7%) on Thursday.
 According to the 12,024 incident reports from years 2002 - 2018 most fires (10.2%) took place during April, and the least (6.4%) in September.
 Out of all 119,298 cases reported during the years 2002 - 2018, the most belonged to the categories: Rescue & EMS (59.4%), Fire (10.1%), and Hazardous Condition (9.9%).
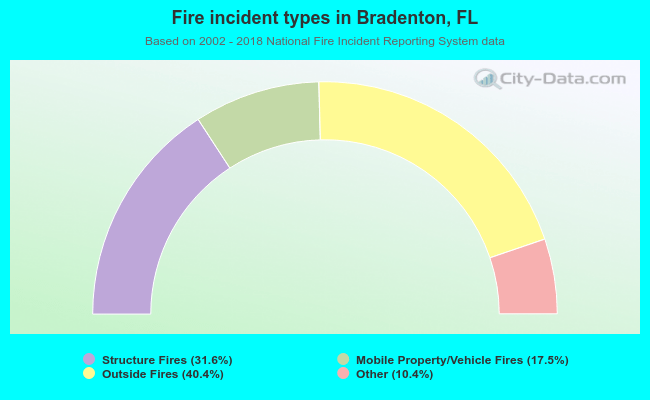 When looking into fire subcategories, the most incidents belonged to: Outside Fires (40.4%), and Structure Fires (31.6%).