Bluefield: Fire Incidents, West Virginia (WV)
Where are fire incidents reported in Bluefield, WV
Something went wrong! Please refresh the page.
| Fire incidents reported | |
|---|---|
| Sreet name | Count |
| UNION ST | 56 |
| BLUEFIELD AVE | 50 |
| CUMBERLAND RD | 50 |
| BLAND ST | 40 |
| COLLEGE AVE | 38 |
| HIGHLAND AVE | 32 |
| THIRD ST | 32 |
| WAYNE ST | 30 |
| CHERRY ST | 28 |
| HILL AVE | 28 |
| INGLESIDE RD | 28 |
| PRINCETON AVE | 26 |
| CERES HOLLOW RD | 24 |
| AIRPORT RD | 22 |
| COAL HERTIAGE ROAD | 22 |
| GRASSY BRANCH RD | 22 |
| BLUEPRINCE RD | 20 |
| FEDERAL ST | 20 |
| I77 HWY | 20 |
| JOHN NASH BLVD | 20 |
| AUGUSTA ST | 18 |
| CAROLINA AVE | 18 |
| NORTH ST | 18 |
| FREDRICK ST | 16 |
| HURRICANE RIDGE RD | 16 |
| COAL HERTIAGE RD | 14 |
| MERCER MALL RD | 14 |
| OLD BRAMWELL RD | 14 |
| STADIUM DR | 14 |
| AIRPORT ROAD | 12 |
| Other | 1,015 |
2002 - 2018 National Fire Incident Reporting System (NFIRS) incidents
- Incident types reported to NFIRS in Bluefield, WV
- 2,34528.7%Rescue & EMS
- 1,77721.7%Fire
- 1,64920.2%Hazardous Condition
- 1,03612.7%False Alarm
- 7258.9%Good Intent Call
- 5566.8%Service Call
- 380.5%Special Incident
- 300.4%Severe Weather
- 150.2%Overpressure Rupture
- Fire incident types reported to NFIRS in Bluefield, WV
- 1,00056.3%Structure Fires
- 50928.6%Outside Fires
- 22412.6%Mobile Property/Vehicle Fires
- 442.5%Other
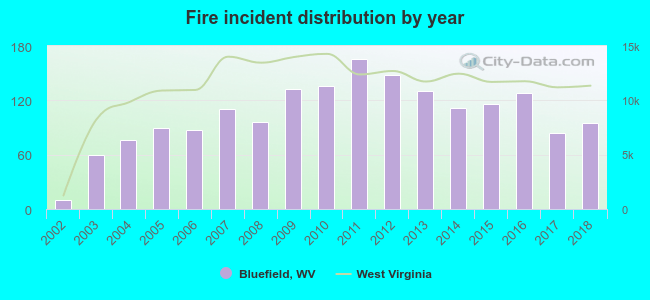 According to the data from the years 2002 - 2018 the average number of fires per year is 105. The highest number of fires - 166 took place in 2011, and the least - 10 in 2002. The data has an increasing trend.
The average number of yearly fire incidents per 10k residents in Bluefield, WV compared to nearest cities:
(Note: Based on data for the last 3 years, including only cities with population 5,000 and above)
| Bluefield: | 97.9 |
| Princeton: | 245.3 |
 The median response time based on all reported fire incidents is 6 minutes. This is lower compared to the state median value.
The median response time in Bluefield, WV compared to nearest cities:
(Note: Based on data for all years, including only cities with at least 500 fire incidents)
| Bluefield: | 6 minutes |
| Bluefield: | 8 minutes |
| Princeton: | 8 minutes |
| Wytheville: | 8 minutes |
| Pulaski: | 5 minutes |
| Dublin: | 7 minutes |
| Hinton: | 9 minutes |
| Marion: | 8 minutes |
 Based on the data from the years 2002 - 2018 the average number of fire-related yearly deaths is 1. The highest number of deaths - 3 took place in 2017, and the lowest - 0 in 2002. The data has a growing trend.
 According to the data from the years 2002 - 2018 the average number of fire-related yearly casualties is 1. The highest number of reported casualties - 6 took place in 2003, and the lowest - 0 in 2002. The data has a constant trend.
The average number of casualties per 1,000 fire incidents is 10. This indicator was the highest - 100 in 2003, and the lowest 0 in 2002. The trend for casualties per 1,000 fires is constant. Compared to the state value the number of casualties per 1,000 fire incidents is similar.
According to the data from the years 2002 - 2018 the average number of fire-related yearly casualties is 1. The highest number of reported casualties - 6 took place in 2003, and the lowest - 0 in 2002. The data has a constant trend.
The average number of casualties per 1,000 fire incidents is 10. This indicator was the highest - 100 in 2003, and the lowest 0 in 2002. The trend for casualties per 1,000 fires is constant. Compared to the state value the number of casualties per 1,000 fire incidents is similar.
 35.8% incidents where reported in the morning and 64.2% in the evening. The most fires (15.1%) took place on Monday, and the least (13.3%) on Tuesday.
 According to the 1,777 fire incident reports from years 2002 - 2018 most fires (11.9%) took place during November, and the least (6.7%) in September.
 Out of all 8,171 cases reported during the years 2002 - 2018, the most belonged to the categories: Rescue & EMS (28.7%), Fire (21.7%), and Hazardous Condition (20.2%).
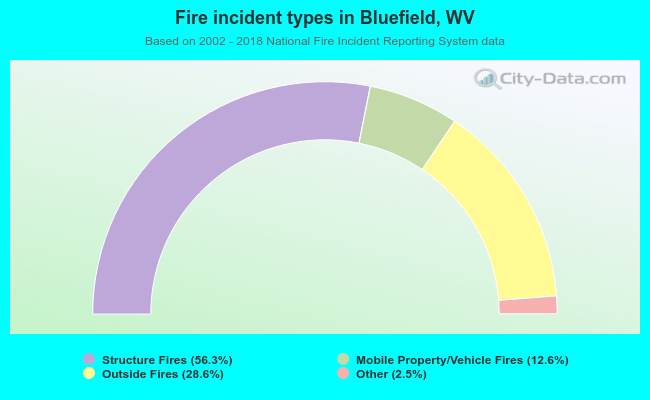 When looking into fire subcategories, the most incidents belonged to: Structure Fires (56.3%), and Outside Fires (28.6%).