Blandon: Fire Incidents, Pennsylvania (PA)
Where are fire incidents reported in Blandon, PA
Something went wrong! Please refresh the page.
|
| |||||||||||||||||||||||||||||||||||||||||||||||||||||||||||||||||||||||||||||||||||||||||||||||||||||||||||||
2003 - 2018 National Fire Incident Reporting System (NFIRS) incidents
- Incident types reported to NFIRS in Blandon, PA
- 25735.4%Fire
- 23932.9%Hazardous Condition
- 11215.4%Rescue & EMS
- 446.1%Good Intent Call
- 435.9%Service Call
- 294.0%False Alarm
- 10.1%Severe Weather
- 10.1%Special Incident
- Fire incident types reported to NFIRS in Blandon, PA
- 17969.6%Structure Fires
- 3714.4%Outside Fires
- 228.6%Other
- 197.4%Mobile Property/Vehicle Fires
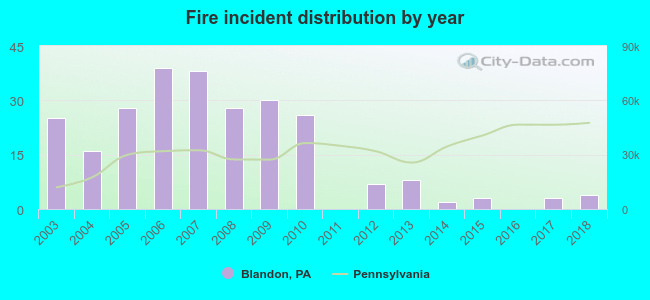 According to the data from the years 2003 - 2018 the average number of fires per year is 16. The highest number of reported fire incidents - 39 took place in 2006, and the least - 0 in 2011. The data has a declining trend.
The average number of yearly fire incidents per 10k residents in Blandon, PA compared to nearest cities:
(Note: Based on data for the last 3 years, including only cities with population 5,000 and above)
| Blandon: | 4.9 |
| Reading: | 69.4 |
| Kutztown: | 94.4 |
| Wyomissing: | 48.1 |
| Shillington: | 50.7 |
| Birdsboro: | 87.4 |
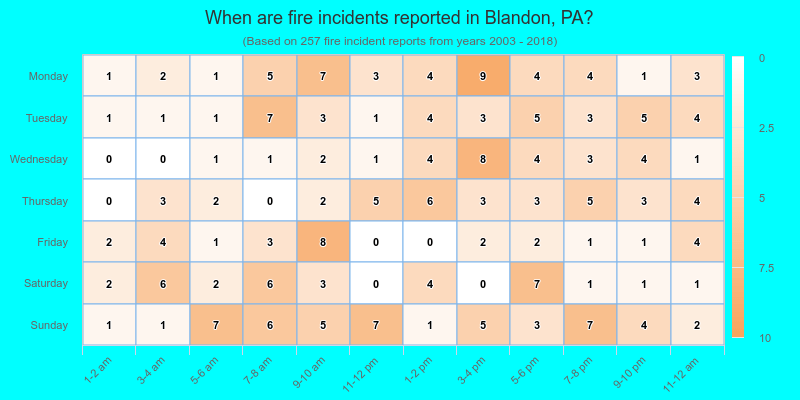
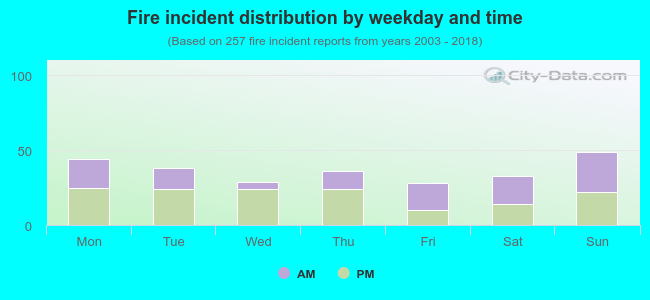 44.4% incidents where reported in the morning and 55.6% in the evening. The most fires (19.1%) took place on Sunday, and the least (10.9%) on Friday.
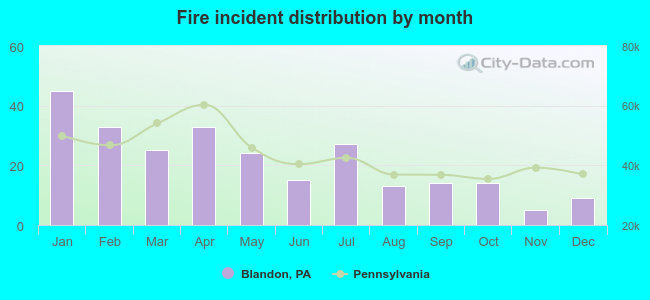 Based on the 257 fire incidents from years 2003 - 2018 most fires (17.5%) took place during January, and the least (1.9%) in November.
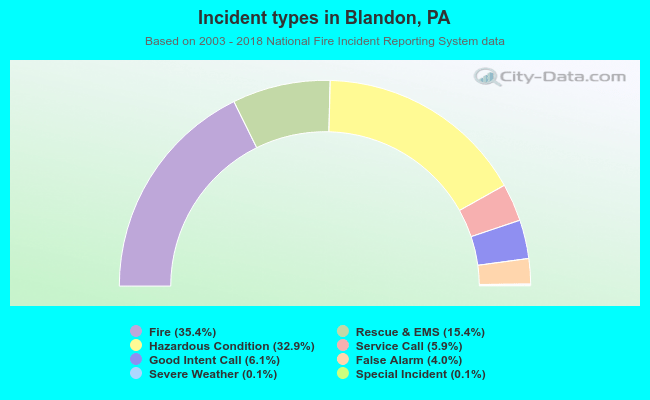 Out of all 726 cases reported during the years 2003 - 2018, the most belonged to the categories: Fire (35.4%), Rescue & EMS (32.9%), and Overpressure Rupture (15.4%).
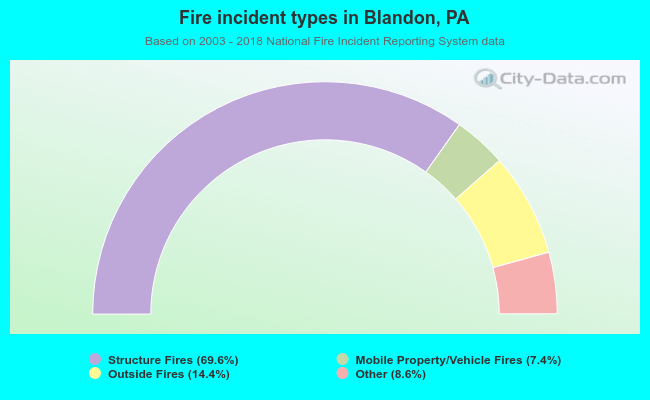 When looking into fire subcategories, the most incidents belonged to: Structure Fires (69.6%), and Outside Fires (14.4%).