Big Bear City: Fire Incidents, California (CA)
Where are fire incidents reported in Big Bear City, CA
Something went wrong! Please refresh the page.
|
| |||||||||||||||||||||||||||||||||||||||||||||||||||||||||||||||||||||||||||||||||||||||||||||||||||||||||||||
2005 - 2018 National Fire Incident Reporting System (NFIRS) incidents
- Incident types reported to NFIRS in Big Bear City, CA
- 40027.6%Rescue & EMS
- 34023.5%Hazardous Condition
- 31121.5%Fire
- 17812.3%Service Call
- 1409.7%Good Intent Call
- 704.8%False Alarm
- 60.4%Special Incident
- 20.1%Overpressure Rupture
- Fire incident types reported to NFIRS in Big Bear City, CA
- 15549.8%Structure Fires
- 11436.7%Outside Fires
- 227.1%Mobile Property/Vehicle Fires
- 206.4%Other
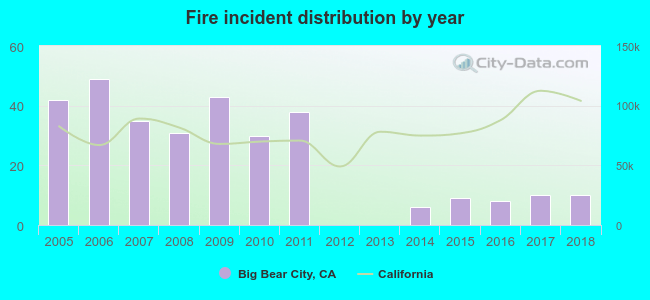 According to the data from the years 2005 - 2018 the average number of fires per year is 22. The highest number of reported fires - 49 took place in 2006, and the least - 0 in 2012. The data has a dropping trend.
The average number of yearly fire incidents per 10k residents in Big Bear City, CA compared to nearest cities:
(Note: Based on data for the last 3 years, including only cities with population 5,000 and above)
| Big Bear City: | 7.6 |
| Big Bear Lake: | 3.9 |
| Big Bear: | 5.2 |
| Lucerne Valley: | 30.4 |
| Lake Arrowhead: | 6.7 |
| Yucaipa: | 2.6 |
| Mentone: | 16.8 |
| Cherry Valley: | 6.3 |
| Calimesa: | 15.8 |

 28.0% incidents where reported in the morning and 72.0% in the evening. The most fires (23.2%) took place on Saturday, and the least (10.3%) on Thursday.
 According to the 311 reports from years 2005 - 2018 most fires (13.5%) took place during November, and the least (4.5%) in August.
 Out of all 1,447 cases reported during the years 2005 - 2018, the most belonged to the categories: Rescue & EMS (27.6%), Hazardous Condition (23.5%), and Fire (21.5%).
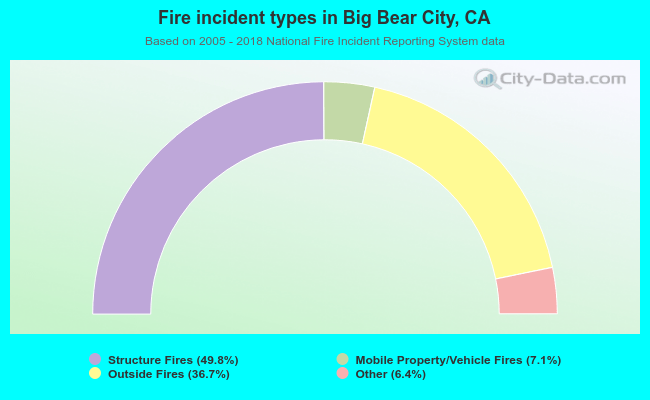 When looking into fire subcategories, the most reports belonged to: Structure Fires (49.8%), and Outside Fires (36.7%).