Bettendorf: Fire Incidents, Iowa (IA)
Where are fire incidents reported in Bettendorf, IA
Something went wrong! Please refresh the page.
| Fire incidents reported | |
|---|---|
| Sreet name | Count |
| STATE ST | 98 |
| STATE ST | 64 |
| MIDDLE RD | 60 |
| DEVILS GLEN RD | 52 |
| VALLEY DR | 50 |
| MIDDLE RD | 48 |
| DEVILS GLEN RD | 44 |
| I80 | 30 |
| KIMBERLY RD | 24 |
| CHATEAU KNOLL | 22 |
| GRANT ST | 22 |
| 33RD ST | 20 |
| UTICA RIDGE RD | 20 |
| VALLEY DR | 20 |
| 18TH ST | 18 |
| 33 ST | 18 |
| KIMBERLY RD | 18 |
| SPRUCE HILLS DR | 18 |
| 18 ST | 16 |
| 23 ST | 16 |
| 23RD ST | 16 |
| CENTRAL AVE | 16 |
| HAWTHORNE DR | 16 |
| I74 | 16 |
| LINCOLN RD | 16 |
| PARKWAY DR | 16 |
| CENTRAL AV | 14 |
| THUNDER RIDGE RD | 14 |
| 14 ST | 12 |
| 15TH ST | 12 |
| Other | 254 |
2002 - 2018 National Fire Incident Reporting System (NFIRS) incidents
- Incident types reported to NFIRS in Bettendorf, IA
- 7,79860.3%Rescue & EMS
- 1,53111.8%Hazardous Condition
- 1,0808.4%Fire
- 8746.8%Good Intent Call
- 8466.5%False Alarm
- 7295.6%Service Call
- 390.3%Severe Weather
- 140.1%Special Incident
- 130.1%Overpressure Rupture
- Fire incident types reported to NFIRS in Bettendorf, IA
- 57853.5%Structure Fires
- 26224.3%Outside Fires
- 19117.7%Mobile Property/Vehicle Fires
- 494.5%Other
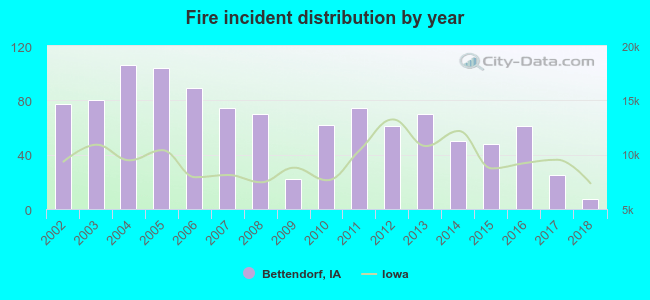 Based on the data from the years 2002 - 2018 the average number of fire incidents per year is 64. The highest number of fires - 106 took place in 2004, and the least - 7 in 2018. The data has a dropping trend.
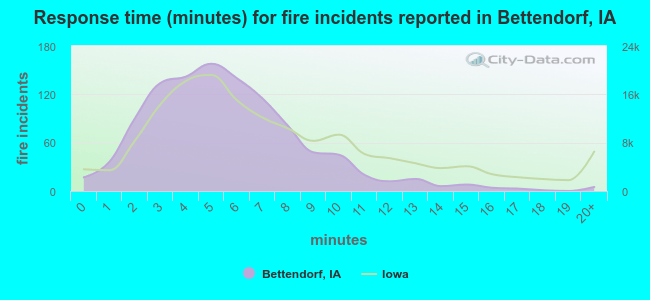 The median response time based on all reported fire incidents is 5 minutes. This is lower than the Iowa median value.
The median response time in Bettendorf, IA compared to nearest cities:
(Note: Based on data for all years, including only cities with at least 500 fire incidents)
| Bettendorf: | 5 minutes |
| East Moline: | 5 minutes |
| Moline: | 5 minutes |
| Davenport: | 3 minutes |
| Rock Island: | 4 minutes |
| Milan: | 8 minutes |
| Colona: | 6 minutes |
| Geneseo: | 8 minutes |
| Clinton: | 5 minutes |
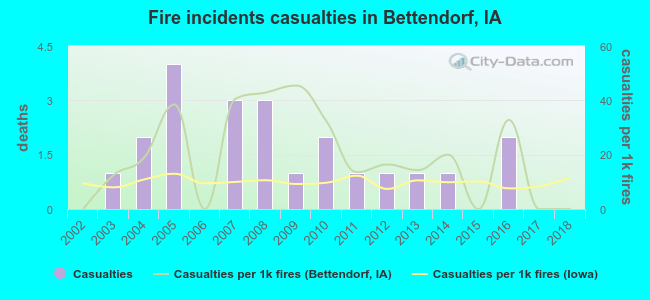 According to the data from the years 2002 - 2018 the average number of fire-related yearly casualties is 1. The highest number of injuries - 4 took place in 2005, and the lowest - 0 in 2002. The data has a constant trend.
The average number of casualties per 1,000 fires is 19. This indicator was the highest - 45 in 2009, and the lowest 0 in 2002. The trend for casualties per 1,000 fires is dropping. Compared to the Iowa value the number of injuries per 1,000 fire incidents is much higher.
According to the data from the years 2002 - 2018 the average number of fire-related yearly casualties is 1. The highest number of injuries - 4 took place in 2005, and the lowest - 0 in 2002. The data has a constant trend.
The average number of casualties per 1,000 fires is 19. This indicator was the highest - 45 in 2009, and the lowest 0 in 2002. The trend for casualties per 1,000 fires is dropping. Compared to the Iowa value the number of injuries per 1,000 fire incidents is much higher.Casualties per 1,000 incidents in Bettendorf, IA compared to nearest cities:
(Note: Based on data for all years, including only cities with at least 500 fire incidents)
| Bettendorf: | 20.4 |
| East Moline: | 6.8 |
| Moline: | 12.3 |
| Davenport: | 14.4 |
| Rock Island: | 4.0 |
| Milan: | 0.0 |
| Colona: | 0.0 |
| Geneseo: | 0.0 |
| Clinton: | 26.7 |
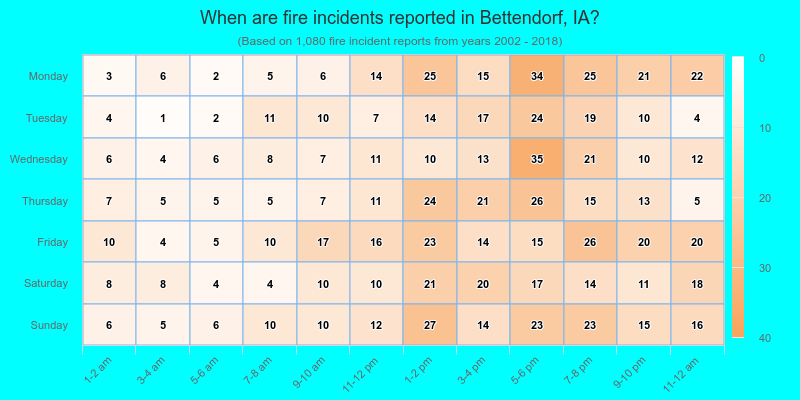
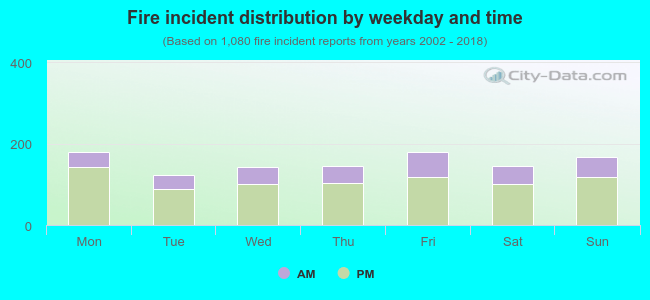 28.5% incidents where reported in the morning and 71.5% in the evening. The most fires (16.7%) took place on Friday, and the least (11.4%) on Tuesday.
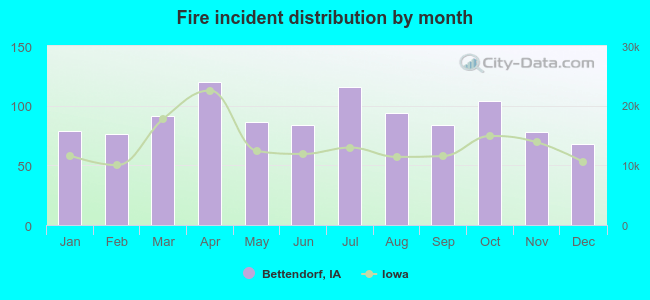 Based on the 1,080 fire incident reports from years 2002 - 2018 most fires (11.1%) took place during April, and the least (6.3%) in December.
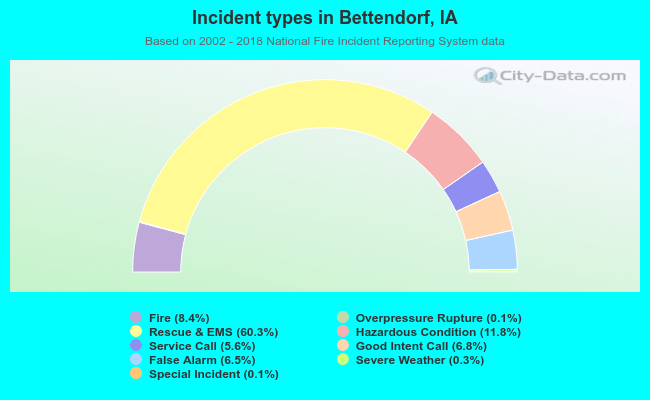 Out of all 12,924 cases reported during the years 2002 - 2018, the most belonged to the categories: Rescue & EMS (60.3%), Hazardous Condition (11.8%), and Fire (8.4%).
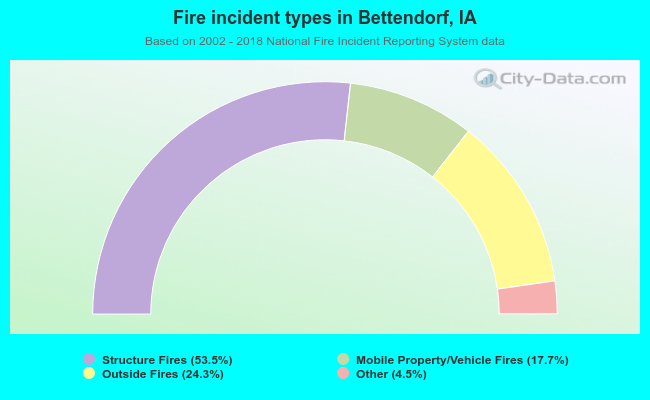 When looking into fire subcategories, the most incidents belonged to: Structure Fires (53.5%), and Outside Fires (24.3%).