Berwyn: Fire Incidents, Illinois (IL)
Where are fire incidents reported in Berwyn, IL
Something went wrong! Please refresh the page.
| Fire incidents reported | |
|---|---|
| Sreet name | Count |
| CERMAK RD | 322 |
| OAK PARK AVE | 262 |
| GROVE AVE | 248 |
| RIDGELAND AVE | 246 |
| EUCLID AVE | 222 |
| HARVEY AVE | 210 |
| HIGHLAND AVE | 208 |
| KENILWORTH AVE | 180 |
| CUYLER AVE | 166 |
| ELMWOOD AVE | 162 |
| HARLEM AVE | 158 |
| EAST AVE | 156 |
| SCOVILLE AVE | 154 |
| GUNDERSON AVE | 148 |
| HOME AVE | 140 |
| WESLEY AVE | 140 |
| MAPLE AVE | 134 |
| ROOSEVELT RD | 134 |
| CLARENCE AVE | 122 |
| 26TH ST | 118 |
| CLINTON AVE | 116 |
| LOMBARD AVE | 94 |
| WISCONSIN AVE | 92 |
| OGDEN AVE | 90 |
| 16TH ST | 78 |
| WENONAH AVE | 78 |
| WINDSOR AVE | 56 |
| STANLEY AVE | 46 |
| 34TH ST | 38 |
| CERMAK | 38 |
2002 - 2018 National Fire Incident Reporting System (NFIRS) incidents
- Incident types reported to NFIRS in Berwyn, IL
- 26,22558.0%Rescue & EMS
- 6,06513.4%Service Call
- 4,58210.1%Hazardous Condition
- 3,3387.4%False Alarm
- 2,7096.0%Fire
- 2,1344.7%Good Intent Call
- 920.2%Special Incident
- 510.1%Severe Weather
- 490.1%Overpressure Rupture
- Fire incident types reported to NFIRS in Berwyn, IL
- 1,57958.3%Structure Fires
- 52919.5%Outside Fires
- 52119.2%Mobile Property/Vehicle Fires
- 803.0%Other
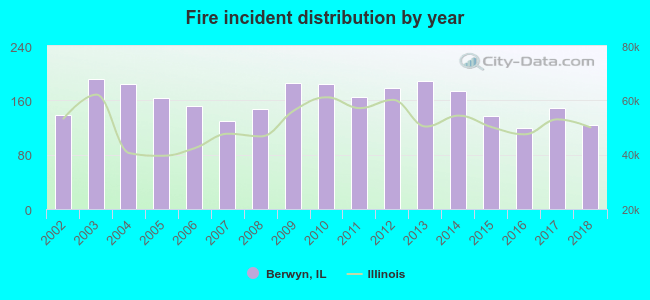 According to the data from the years 2002 - 2018 the average number of fire incidents per year is 159. The highest number of reported fires - 191 took place in 2003, and the least - 119 in 2016. The data has a declining trend.
The average number of yearly fire incidents per 10k residents in Berwyn, IL compared to nearest cities:
(Note: Based on data for the last 3 years, including only cities with population 5,000 and above)
| Berwyn: | 23.0 |
| Cicero: | 25.7 |
| Riverside: | 20.6 |
| Stickney: | 48.4 |
| North Riverside: | 31.4 |
| Forest Park: | 45.8 |
| Lyons: | 67.8 |
| Oak Park: | 26.3 |
| Brookfield: | 36.6 |
 The median response time based on all reported fire incidents is 3 minutes. This is lower than the Illinois median value.
The median response time in Berwyn, IL compared to nearest cities:
(Note: Based on data for all years, including only cities with at least 500 fire incidents)
| Berwyn: | 3 minutes |
| Cicero: | 3 minutes |
| Riverside: | 6 minutes |
| Stickney: | 5 minutes |
| Forest Park: | 5 minutes |
| Lyons: | 5 minutes |
| Oak Park: | 5 minutes |
| Brookfield: | 5 minutes |
| Broadview: | 3 minutes |
 Based on the reports from the years 2002 - 2018 the average number of fire-related yearly deaths is 0. The highest number of reported deaths - 2 took place in 2014, and the lowest - 0 in 2002. The data has a constant trend.
The average number of fatalities per 1,000 fire incidents is 3. This indicator was the highest - 11 in 2014, and the lowest 0 in 2002. The trend for fatalities per 1,000 fire incidents is increasing. Compared to the state value the number of fatalities per 1,000 fires is higher.
Based on the reports from the years 2002 - 2018 the average number of fire-related yearly deaths is 0. The highest number of reported deaths - 2 took place in 2014, and the lowest - 0 in 2002. The data has a constant trend.
The average number of fatalities per 1,000 fire incidents is 3. This indicator was the highest - 11 in 2014, and the lowest 0 in 2002. The trend for fatalities per 1,000 fire incidents is increasing. Compared to the state value the number of fatalities per 1,000 fires is higher.
 According to the reports from the years 2002 - 2018 the average number of fire-related yearly casualties is 3. The highest number of injuries - 11 took place in 2011, and the lowest - 0 in 2002. The data has a constant trend.
The average number of injuries per 1,000 fire incidents is 15. This indicator was the highest - 67 in 2011, and the lowest 0 in 2002. The trend for injuries per 1,000 incidents is constant. Compared to the state value the number of casualties per 1,000 incidents is higher.
According to the reports from the years 2002 - 2018 the average number of fire-related yearly casualties is 3. The highest number of injuries - 11 took place in 2011, and the lowest - 0 in 2002. The data has a constant trend.
The average number of injuries per 1,000 fire incidents is 15. This indicator was the highest - 67 in 2011, and the lowest 0 in 2002. The trend for injuries per 1,000 incidents is constant. Compared to the state value the number of casualties per 1,000 incidents is higher.Casualties per 1,000 incidents in Berwyn, IL compared to nearest cities:
(Note: Based on data for all years, including only cities with at least 500 fire incidents)
| Berwyn: | 15.9 |
| Cicero: | 13.7 |
| Riverside: | 11.7 |
| Stickney: | 8.8 |
| Forest Park: | 8.3 |
| Lyons: | 15.7 |
| Oak Park: | 11.2 |
| Brookfield: | 19.1 |
| Broadview: | 17.9 |
 38.8% incidents where reported in the morning and 61.2% in the evening. The most fires (15.9%) took place on Sunday, and the least (13.3%) on Thursday.
 According to the 2,709 reports from years 2002 - 2018 most fires (11.6%) took place during July, and the least (6.3%) in November.
 Out of all 45,245 cases reported during the years 2002 - 2018, the most belonged to the categories: Rescue & EMS (58.0%), Service Call (13.4%), and Hazardous Condition (10.1%).
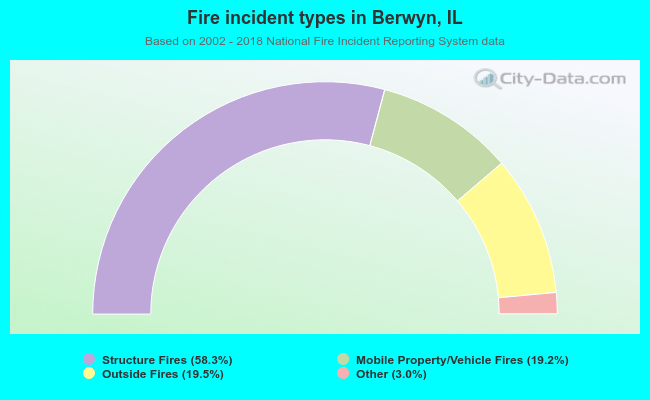 When looking into fire subcategories, the most reports belonged to: Structure Fires (58.3%), and Outside Fires (19.5%).