Bensenville: Fire Incidents, Illinois (IL)
Where are fire incidents reported in Bensenville, IL
Something went wrong! Please refresh the page.
| Fire incidents reported | |
|---|---|
| Sreet name | Count |
| YORK | 186 |
| GEORGE | 154 |
| GREEN | 110 |
| THOMAS | 96 |
| CHURCH | 78 |
| YORK RD | 78 |
| IRVING PARK | 74 |
| SUPREME | 56 |
| GEORGE ST | 54 |
| HILLSIDE | 54 |
| IRVING PARK RD | 54 |
| RT 83 | 52 |
| GRAND | 50 |
| THOMAS DR | 46 |
| EAGLE | 42 |
| RT. 83 | 40 |
| INDUSTRIAL | 38 |
| MAIN | 38 |
| MASON | 38 |
| THORNDALE | 38 |
| ARGYLE | 34 |
| JEFFERSON | 34 |
| ROUTE 83 | 34 |
| ADDISON | 28 |
| COUNTY LINE | 28 |
| MARSHALL | 28 |
| CREST | 26 |
| DAVID | 24 |
| FOSTER | 24 |
| GROVE | 24 |
| Other | 16 |
2003 - 2018 National Fire Incident Reporting System (NFIRS) incidents
- Incident types reported to NFIRS in Bensenville, IL
- 6,99336.7%False Alarm
- 6,29633.0%Rescue & EMS
- 1,6768.8%Fire
- 1,6288.5%Good Intent Call
- 1,6168.5%Hazardous Condition
- 8494.4%Service Call
- Fire incident types reported to NFIRS in Bensenville, IL
- 1,11466.5%Structure Fires
- 30918.4%Outside Fires
- 19611.7%Mobile Property/Vehicle Fires
- 573.4%Other
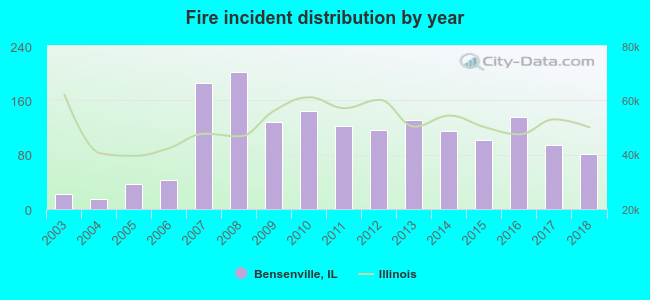 Based on the data from the years 2003 - 2018 the average number of fire incidents per year is 105. The highest number of reported fire incidents - 202 took place in 2008, and the least - 14 in 2004. The data has an increasing trend.
The average number of yearly fire incidents per 10k residents in Bensenville, IL compared to nearest cities:
(Note: Based on data for the last 3 years, including only cities with population 5,000 and above)
| Bensenville: | 55.9 |
| Wood Dale: | 30.6 |
| Addison: | 33.4 |
| Schiller Park: | 49.5 |
| Northlake: | 33.7 |
| Itasca: | 53.8 |
| Elk Grove Village: | 36.0 |
| Franklin Park: | 39.5 |
| Elmhurst: | 18.9 |
 The median response time based on all reported fire incidents is 6 minutes. This is similar to the Illinois median value.
The median response time in Bensenville, IL compared to nearest cities:
(Note: Based on data for all years, including only cities with at least 500 fire incidents)
| Bensenville: | 6 minutes |
| Wood Dale: | 5 minutes |
| Addison: | 5 minutes |
| Schiller Park: | 4 minutes |
| Northlake: | 5 minutes |
| Itasca: | 6 minutes |
| Elk Grove Village: | 5 minutes |
| Franklin Park: | 4 minutes |
| Elmhurst: | 5 minutes |
 Based on the reports from the years 2003 - 2018 the average number of fire-related yearly deaths is 0. The highest number of reported deaths - 1 took place in 2012, and the lowest - 0 in 2003. The data has a constant trend.
 According to the reports from the years 2003 - 2018 the average number of fire-related casualties per year is 1. The highest number of reported casualties - 4 took place in 2008, and the lowest - 0 in 2003. The data has a constant trend.
The average number of injuries per 1,000 fire incidents is 6. This indicator was the highest - 21 in 2010, and the lowest 0 in 2003. The trend for casualties per 1,000 fire incidents is constant. Compared to the Illinois value the number of injuries per 1,000 incidents is lower.
According to the reports from the years 2003 - 2018 the average number of fire-related casualties per year is 1. The highest number of reported casualties - 4 took place in 2008, and the lowest - 0 in 2003. The data has a constant trend.
The average number of injuries per 1,000 fire incidents is 6. This indicator was the highest - 21 in 2010, and the lowest 0 in 2003. The trend for casualties per 1,000 fire incidents is constant. Compared to the Illinois value the number of injuries per 1,000 incidents is lower.Casualties per 1,000 incidents in Bensenville, IL compared to nearest cities:
(Note: Based on data for all years, including only cities with at least 500 fire incidents)
| Bensenville: | 8.9 |
| Wood Dale: | 13.0 |
| Addison: | 15.0 |
| Schiller Park: | 8.6 |
| Northlake: | 4.7 |
| Itasca: | 13.4 |
| Elk Grove Village: | 14.2 |
| Franklin Park: | 15.4 |
| Elmhurst: | 9.7 |
 38.3% incidents where reported in the morning and 61.7% in the evening. The most fires (16.0%) took place on Tuesday, and the least (12.9%) on Monday.
 According to the 1,676 reports from years 2003 - 2018 most fires (11.9%) took place during March, and the least (5.5%) in December.
 Out of all 19,079 cases reported during the years 2003 - 2018, the most belonged to the categories: False Alarm (36.7%), Rescue & EMS (33.0%), and Fire (8.8%).
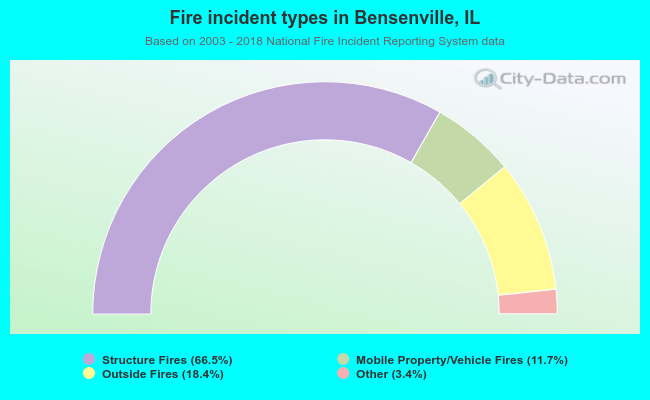 When looking into fire subcategories, the most reports belonged to: Structure Fires (66.5%), and Outside Fires (18.4%).