Beaverton: Fire Incidents, Oregon (OR)
Where are fire incidents reported in Beaverton, OR
Something went wrong! Please refresh the page.
| Fire incidents reported | |
|---|---|
| Sreet name | Count |
| LOMBARD AVE | 186 |
| UNREPORTED | 184 |
| 185TH AVE | 138 |
| FARMINGTON RD | 130 |
| WALKER RD | 128 |
| MURRAY BLVD | 116 |
| MILLIKAN WAY | 110 |
| CORNELL RD | 104 |
| TH | 102 |
| BEAVERTON HILLSDALE | 100 |
| HALL BLVD | 100 |
| HALL | 94 |
| CEDAR HILLS BLVD | 88 |
| SCHOLLS FERRY RD | 88 |
| 170TH AVE | 86 |
| ALLEN | 86 |
| MURRAY | 86 |
| ALLEN BLVD | 82 |
| CANYON | 72 |
| CANYON RD | 72 |
| BEAVERTON HILLSDALE HWY | 70 |
| SCHOLLS FERRY | 70 |
| WALKER | 66 |
| EDGEWAY DR | 64 |
| MILLIKAN | 64 |
| TUALATIN VALLEY HWY | 60 |
| CEDAR HILLS | 58 |
| CORNELL | 58 |
| FARMINGTON | 58 |
| LOMBARD | 56 |
| Other | 2,782 |
2002 - 2018 National Fire Incident Reporting System (NFIRS) incidents
- Incident types reported to NFIRS in Beaverton, OR
- 26,81557.2%Rescue & EMS
- 5,98112.8%Good Intent Call
- 5,55811.8%Fire
- 3,3877.2%Service Call
- 3,1526.7%Hazardous Condition
- 1,9464.1%False Alarm
- Fire incident types reported to NFIRS in Beaverton, OR
- 2,91052.4%Outside Fires
- 1,87933.8%Structure Fires
- 66512.0%Mobile Property/Vehicle Fires
- 1041.9%Other
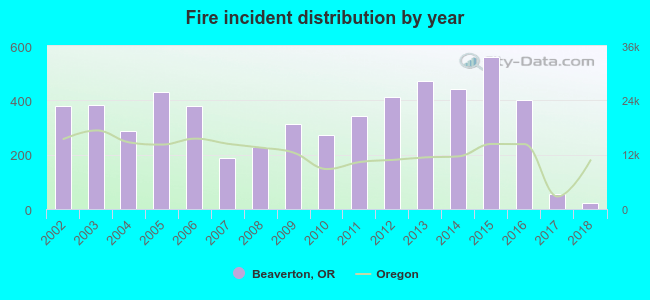 According to the data from the years 2002 - 2018 the average number of fire incidents per year is 327. The highest number of fire incidents - 560 took place in 2015, and the least - 22 in 2018. The data has a dropping trend.
The average number of yearly fire incidents per 10k residents in Beaverton, OR compared to nearest cities:
(Note: Based on data for the last 3 years, including only cities with population 5,000 and above)
| Beaverton: | 16.8 |
| Aloha: | 0.9 |
| Tigard: | 12.3 |
| Hillsboro: | 10.2 |
| Lake Oswego: | 12.6 |
| Tualatin: | 14.5 |
| Sherwood: | 7.9 |
| Portland: | 17.5 |
| Milwaukie: | 31.5 |
 The median response time based on all reported fire incidents is 6 minutes. This is about the same as the Oregon median value.
The median response time in Beaverton, OR compared to nearest cities:
(Note: Based on data for all years, including only cities with at least 500 fire incidents)
| Beaverton: | 6 minutes |
| Aloha: | 6 minutes |
| Tigard: | 6 minutes |
| Hillsboro: | 5 minutes |
| Lake Oswego: | 6 minutes |
| Tualatin: | 6 minutes |
| Sherwood: | 7 minutes |
| Portland: | 5 minutes |
| Milwaukie: | 5 minutes |
 According to the reports from the years 2002 - 2018 the average number of fire-related fatalities per year is 1. The highest number of deaths - 2 took place in 2005, and the lowest - 0 in 2002. The data has a constant trend.
The average number of fatalities per 1,000 fires is 2. This indicator was the highest - 5 in 2005, and the lowest 0 in 2002. The trend for deaths per 1,000 incidents is constant. Compared to the state value the number of deaths per 1,000 fire incidents is about the same.
According to the reports from the years 2002 - 2018 the average number of fire-related fatalities per year is 1. The highest number of deaths - 2 took place in 2005, and the lowest - 0 in 2002. The data has a constant trend.
The average number of fatalities per 1,000 fires is 2. This indicator was the highest - 5 in 2005, and the lowest 0 in 2002. The trend for deaths per 1,000 incidents is constant. Compared to the state value the number of deaths per 1,000 fire incidents is about the same.
 Based on the data from the years 2002 - 2018 the average number of fire-related yearly casualties is 5. The highest number of reported injuries - 10 took place in 2016, and the lowest - 0 in 2018. The data has a decreasing trend.
The average number of injuries per 1,000 fires is 16. This indicator was the highest - 37 in 2017, and the lowest 0 in 2018. The trend for casualties per 1,000 fire incidents is declining. Compared to the state value the number of casualties per 1,000 fire incidents is higher.
Based on the data from the years 2002 - 2018 the average number of fire-related yearly casualties is 5. The highest number of reported injuries - 10 took place in 2016, and the lowest - 0 in 2018. The data has a decreasing trend.
The average number of injuries per 1,000 fires is 16. This indicator was the highest - 37 in 2017, and the lowest 0 in 2018. The trend for casualties per 1,000 fire incidents is declining. Compared to the state value the number of casualties per 1,000 fire incidents is higher.
 33.5% incidents where reported in the morning and 66.5% in the evening. The most fires (15.0%) took place on Friday, and the least (13.8%) on Thursday.
 According to the 5,558 fires from years 2002 - 2018 most fires (20.3%) took place during July, and the least (3.9%) in November.
 Out of all 46,903 cases reported during the years 2002 - 2018, the most belonged to the categories: Rescue & EMS (57.2%), Good Intent Call (12.8%), and Fire (11.8%).
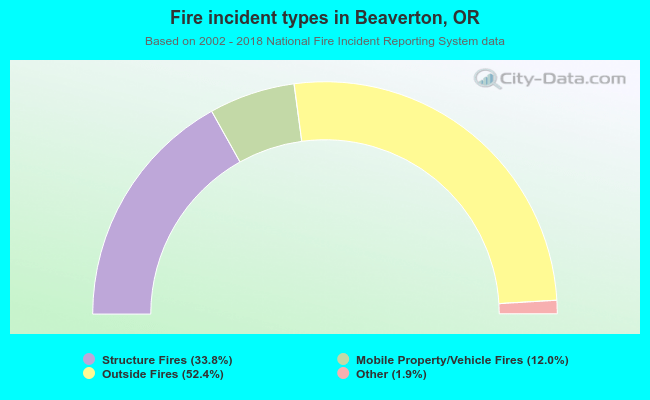 When looking into fire subcategories, the most reports belonged to: Outside Fires (52.4%), and Structure Fires (33.8%).