Batesville: Fire Incidents, Arkansas (AR)
Where are fire incidents reported in Batesville, AR
Something went wrong! Please refresh the page.
| Fire incidents reported | |
|---|---|
| Sreet name | Count |
| BATESVILLE BLVD | 194 |
| HARRISON ST | 108 |
| NEWPORT RD | 92 |
| ST LOUIS ST | 84 |
| HEBER SPRINGS RD | 80 |
| WHITE DR | 72 |
| MAIN ST | 68 |
| HARRISON | 64 |
| CENTRAL AVE | 52 |
| STATE ST | 48 |
| ALLEN CHAPEL RD | 46 |
| COLLEGE | 44 |
| NEELEY ST | 42 |
| CAMP TAHKODAH RD | 40 |
| JAMESTOWN LOOP | 40 |
| ST. LOUIS ST | 34 |
| BROAD ST | 30 |
| COLLEGE AVE | 30 |
| MCHUE RD | 30 |
| SHERRILL DR | 28 |
| DOUBLE RD | 26 |
| RUNWAY RD | 26 |
| HAYINE DR | 24 |
| KYLER RD | 24 |
| ST. LOUIS | 24 |
| PORTER ST | 22 |
| STATE | 22 |
| WYCOUGH | 22 |
| CASE | 20 |
| HEBER SPRINGS ROAD | 20 |
| Other | 1,735 |
2002 - 2018 National Fire Incident Reporting System (NFIRS) incidents
- Incident types reported to NFIRS in Batesville, AR
- 3,19145.4%Fire
- 1,83626.1%Rescue & EMS
- 5928.4%Good Intent Call
- 5387.7%Hazardous Condition
- 4746.7%False Alarm
- 3264.6%Service Call
- 340.5%Severe Weather
- 270.4%Special Incident
- 80.1%Overpressure Rupture
- Fire incident types reported to NFIRS in Batesville, AR
- 1,70653.5%Outside Fires
- 96130.1%Structure Fires
- 43813.7%Mobile Property/Vehicle Fires
- 862.7%Other
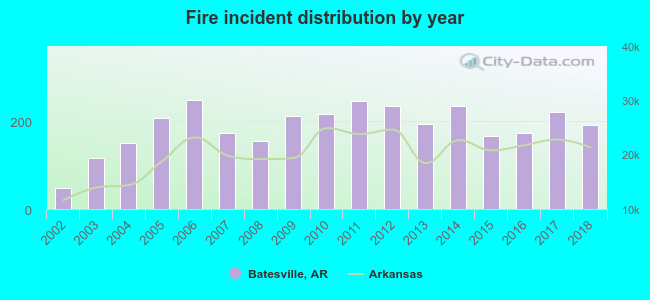 According to the data from the years 2002 - 2018 the average number of fire incidents per year is 188. The highest number of reported fire incidents - 248 took place in 2006, and the least - 47 in 2002. The data has an increasing trend.
The average number of yearly fire incidents per 10k residents in Batesville, AR compared to nearest cities:
(Note: Based on data for the last 3 years, including only cities with population 5,000 and above)
| Batesville: | 186.1 |
| Newport: | 88.7 |
| Heber Springs: | 90.1 |
| Searcy: | 91.0 |
 The median response time based on all reported fire incidents is 4 minutes. This is lower compared to the Arkansas median value.
The median response time in Batesville, AR compared to nearest cities:
(Note: Based on data for all years, including only cities with at least 500 fire incidents)
| Batesville: | 4 minutes |
| Cave City: | 7 minutes |
| Newport: | 4 minutes |
| Melbourne: | 10 minutes |
| Bradford: | 7 minutes |
| Mountain View: | 9 minutes |
| Heber Springs: | 6 minutes |
| Ash Flat: | 6 minutes |
| Bald Knob: | 8 minutes |
 Based on the data from the years 2002 - 2018 the average number of fire-related yearly casualties is 0. The highest number of injuries - 4 took place in 2018, and the lowest - 0 in 2002. The data has a growing trend.
The average number of injuries per 1,000 fire incidents is 3. This indicator was the highest - 21 in 2018, and the lowest 0 in 2002. The trend for casualties per 1,000 fires is increasing. Compared to the state value the number of casualties per 1,000 incidents is much lower.
Based on the data from the years 2002 - 2018 the average number of fire-related yearly casualties is 0. The highest number of injuries - 4 took place in 2018, and the lowest - 0 in 2002. The data has a growing trend.
The average number of injuries per 1,000 fire incidents is 3. This indicator was the highest - 21 in 2018, and the lowest 0 in 2002. The trend for casualties per 1,000 fires is increasing. Compared to the state value the number of casualties per 1,000 incidents is much lower.Casualties per 1,000 incidents in Batesville, AR compared to nearest cities:
(Note: Based on data for all years, including only cities with at least 500 fire incidents)
| Batesville: | 2.5 |
| Cave City: | 2.5 |
| Newport: | 16.0 |
| Melbourne: | 1.4 |
| Bradford: | 3.8 |
| Mountain View: | 5.1 |
| Heber Springs: | 7.1 |
| Ash Flat: | 0.0 |
| Bald Knob: | 0.9 |
 28.2% incidents where reported in the morning and 71.8% in the evening. The most fires (16.5%) took place on Saturday, and the least (13.4%) on Monday.
 According to the 3,191 fires from years 2002 - 2018 most fires (12.8%) took place during March, and the least (5.4%) in May.
 Out of all 7,026 cases reported during the years 2002 - 2018, the most belonged to the categories: Fire (45.4%), Rescue & EMS (26.1%), and Good Intent Call (8.4%).
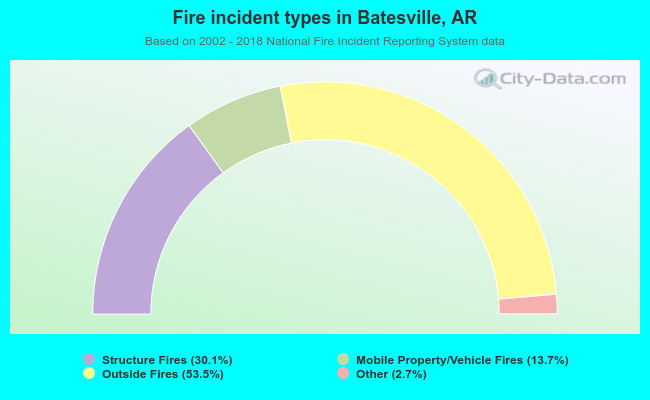 When looking into fire subcategories, the most incidents belonged to: Outside Fires (53.5%), and Structure Fires (30.1%).