Athens: Fire Incidents, Tennessee (TN)
Where are fire incidents reported in Athens, TN
Something went wrong! Please refresh the page.
| Fire incidents reported | |
|---|---|
| Sreet name | Count |
| DECATUR PIKE | 252 |
| CONGRESS PKY | 204 |
| MADISON AVE | 100 |
| JACKSON ST | 76 |
| COUNTY ROAD 750 | 72 |
| I75 | 60 |
| WALKER ST | 60 |
| CR 750 | 42 |
| LAYMAN RD | 38 |
| HAMBY ST | 34 |
| WESTSIDE AVE | 34 |
| LEE DR | 32 |
| WHITE ST | 32 |
| CO RD 180 | 30 |
| CO RD 213 | 30 |
| HWY 305 | 30 |
| INGLESIDE AVE | 30 |
| OLD RICEVILLE RD | 30 |
| WASHINGTON AVE | 30 |
| NORTH AVE | 26 |
| OLD NIOTA RD | 26 |
| PIKE ST | 26 |
| COUNTY ROAD 700 | 24 |
| I-75 | 24 |
| CO RD 172 | 22 |
| COOK DR | 22 |
| COUNTY ROAD 100 | 22 |
| COUNTY ROAD 213 | 22 |
| COUNTY ROAD 656 | 22 |
| DENNIS ST | 22 |
| Other | 1,255 |
2003 - 2018 National Fire Incident Reporting System (NFIRS) incidents
- Incident types reported to NFIRS in Athens, TN
- 2,72941.8%Fire
- 1,19018.2%Rescue & EMS
- 81812.5%False Alarm
- 69610.7%Good Intent Call
- 6469.9%Hazardous Condition
- 4076.2%Service Call
- 210.3%Severe Weather
- 130.2%Special Incident
- Fire incident types reported to NFIRS in Athens, TN
- 1,09140.0%Outside Fires
- 1,03938.1%Structure Fires
- 43315.9%Mobile Property/Vehicle Fires
- 1666.1%Other
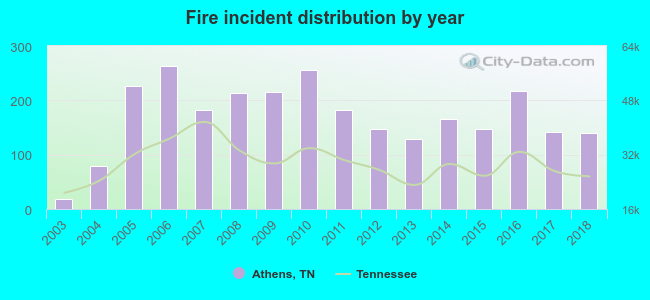 Based on the data from the years 2003 - 2018 the average number of fire incidents per year is 170. The highest number of reported fires - 263 took place in 2006, and the least - 18 in 2003. The data has a growing trend.
The average number of yearly fire incidents per 10k residents in Athens, TN compared to nearest cities:
(Note: Based on data for the last 3 years, including only cities with population 5,000 and above)
| Athens: | 121.5 |
| Sweetwater: | 189.0 |
| Dayton: | 153.7 |
| Loudon: | 166.2 |
| Cleveland: | 116.6 |
| Sale Creek: | 8.3 |
| Rockwood: | 230.3 |
| Kingston: | 160.5 |
| Lenoir City: | 111.8 |
 The median response time based on all reported fire incidents is 6 minutes. This is about the same as the Tennessee median value.
The median response time in Athens, TN compared to nearest cities:
(Note: Based on data for all years, including only cities with at least 500 fire incidents)
| Athens: | 6 minutes |
| Niota: | 10 minutes |
| Englewood: | 8 minutes |
| Riceville: | 11 minutes |
| Etowah: | 8 minutes |
| Decatur: | 10 minutes |
| Sweetwater: | 11 minutes |
| Calhoun: | 5 minutes |
| Madisonville: | 10 minutes |
 According to the data from the years 2003 - 2018 the average number of fire-related fatalities per year is 1. The highest number of reported deaths - 4 took place in 2005, and the lowest - 0 in 2003. The data has an increasing trend.
The average number of fatalities per 1,000 fires is 4. This indicator was the highest - 18 in 2005, and the lowest 0 in 2003. The trend for fatalities per 1,000 fire incidents is growing. Compared to the state value the number of fatalities per 1,000 fires is higher.
According to the data from the years 2003 - 2018 the average number of fire-related fatalities per year is 1. The highest number of reported deaths - 4 took place in 2005, and the lowest - 0 in 2003. The data has an increasing trend.
The average number of fatalities per 1,000 fires is 4. This indicator was the highest - 18 in 2005, and the lowest 0 in 2003. The trend for fatalities per 1,000 fire incidents is growing. Compared to the state value the number of fatalities per 1,000 fires is higher.Deaths per 1,000 incidents in Athens, TN compared to nearest cities:
(Note: Based on data for all years, including only cities with at least 2,500 fire incidents)
| Athens: | 4.4 |
| Cleveland: | 2.9 |
| Harriman: | 2.8 |
| Maryville: | 2.8 |
| Crossville: | 2.4 |
 Based on the reports from the years 2003 - 2018 the average number of fire-related casualties per year is 2. The highest number of reported casualties - 7 took place in 2016, and the lowest - 0 in 2003. The data has a rising trend.
The average number of casualties per 1,000 fire incidents is 12. This indicator was the highest - 51 in 2004, and the lowest 0 in 2003. The trend for injuries per 1,000 fires is increasing. Compared to the state value the number of casualties per 1,000 fires is higher.
Based on the reports from the years 2003 - 2018 the average number of fire-related casualties per year is 2. The highest number of reported casualties - 7 took place in 2016, and the lowest - 0 in 2003. The data has a rising trend.
The average number of casualties per 1,000 fire incidents is 12. This indicator was the highest - 51 in 2004, and the lowest 0 in 2003. The trend for injuries per 1,000 fires is increasing. Compared to the state value the number of casualties per 1,000 fires is higher.Casualties per 1,000 incidents in Athens, TN compared to nearest cities:
(Note: Based on data for all years, including only cities with at least 500 fire incidents)
| Athens: | 11.7 |
| Niota: | 0.0 |
| Englewood: | 5.9 |
| Riceville: | 6.9 |
| Etowah: | 0.8 |
| Decatur: | 4.3 |
| Sweetwater: | 0.0 |
| Calhoun: | 0.0 |
| Madisonville: | 0.5 |
 32.6% incidents where reported in the morning and 67.4% in the evening. The most fires (16.3%) took place on Friday, and the least (13.2%) on Wednesday.
 According to the 2,729 fire incident reports from years 2003 - 2018 most fires (12.7%) took place during March, and the least (6.5%) in December.
 Out of all 6,526 cases reported during the years 2003 - 2018, the most belonged to the categories: Fire (41.8%), Rescue & EMS (18.2%), and False Alarm (12.5%).
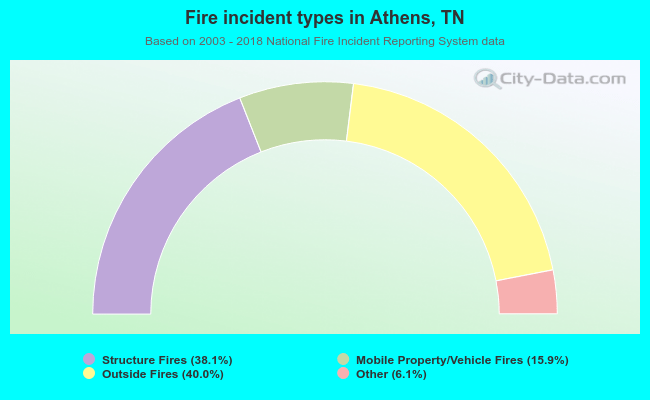 When looking into fire subcategories, the most incidents belonged to: Outside Fires (40.0%), and Structure Fires (38.1%).