Ashland: Fire Incidents, Oregon (OR)
Where are fire incidents reported in Ashland, OR
Something went wrong! Please refresh the page.
| Fire incidents reported | |
|---|---|
| Sreet name | Count |
| MAIN ST | 134 |
| SISKIYOU BLVD | 128 |
| ASHLAND ST | 112 |
| MOUNTAIN AVE | 76 |
| DEAD INDIAN MEMORIAL RD | 64 |
| VALLEY VIEW RD | 54 |
| WALKER AVE | 54 |
| INTERSTATE 5 FWY | 48 |
| UNREPORTED | 48 |
| CLAY ST | 40 |
| NB INTERSTATE 5 | 36 |
| TOLMAN CREEK RD | 34 |
| NEVADA ST | 30 |
| MISTLETOE RD | 28 |
| SB INTERSTATE 5 | 26 |
| OLD HIGHWAY 99 | 24 |
| POMPADOUR DR | 24 |
| WIGHTMAN ST | 24 |
| GRANITE ST | 22 |
| A ST | 20 |
| EAGLE MILL RD | 20 |
| LINCOLN ST | 20 |
| WIMER ST | 20 |
| WINBURN WAY | 20 |
| BUTLER CREEK RD | 18 |
| EAST MAIN ST | 18 |
| MOUNTAIN AV | 18 |
| REITEN DR | 18 |
| COLESTIN RD | 16 |
| EMIGRANT CREEK RD | 16 |
| Other | 123 |
2002 - 2018 National Fire Incident Reporting System (NFIRS) incidents
- Incident types reported to NFIRS in Ashland, OR
- 5,76952.8%Rescue & EMS
- 1,68515.4%Good Intent Call
- 1,33312.2%Fire
- 9398.6%Service Call
- 5735.2%Hazardous Condition
- 5585.1%False Alarm
- 430.4%Special Incident
- 210.2%Overpressure Rupture
- Fire incident types reported to NFIRS in Ashland, OR
- 62546.9%Outside Fires
- 38929.2%Structure Fires
- 20715.5%Mobile Property/Vehicle Fires
- 1128.4%Other
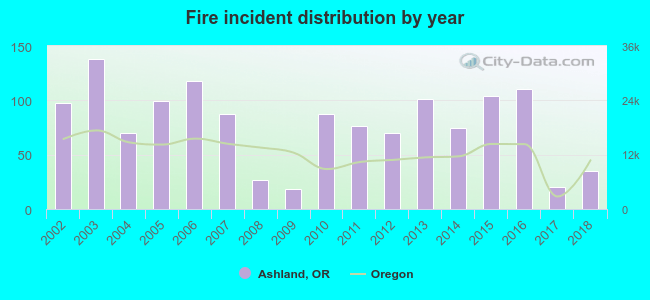 According to the data from the years 2002 - 2018 the average number of fires per year is 78. The highest number of reported fires - 138 took place in 2003, and the least - 18 in 2009. The data has a declining trend.
The average number of yearly fire incidents per 10k residents in Ashland, OR compared to nearest cities:
(Note: Based on data for the last 3 years, including only cities with population 5,000 and above)
| Ashland: | 26.6 |
| Talent: | 27.4 |
| Medford: | 17.4 |
| Central Point: | 29.9 |
| White City: | 25.9 |
| Eagle Point: | 24.4 |
| Grants Pass: | 44.5 |
| Klamath Falls: | 23.4 |
| Tenmile: | 2.1 |
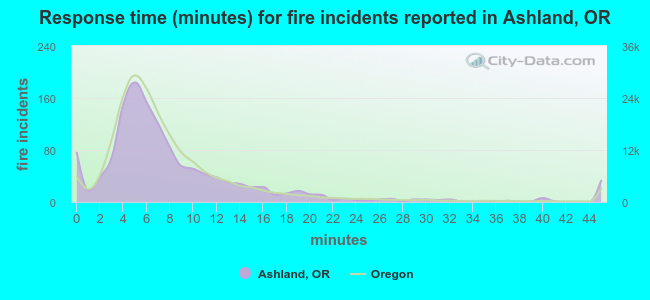 The median response time based on all reported fire incidents is 6 minutes. This is close to the state median value.
The median response time in Ashland, OR compared to nearest cities:
(Note: Based on data for all years, including only cities with at least 500 fire incidents)
| Ashland: | 6 minutes |
| Medford: | 5 minutes |
| Jacksonville: | 10 minutes |
| Central Point: | 8 minutes |
| White City: | 6 minutes |
| Eagle Point: | 9 minutes |
| Grants Pass: | 7 minutes |
| Klamath Falls: | 6 minutes |
| Cave Junction: | 8 minutes |
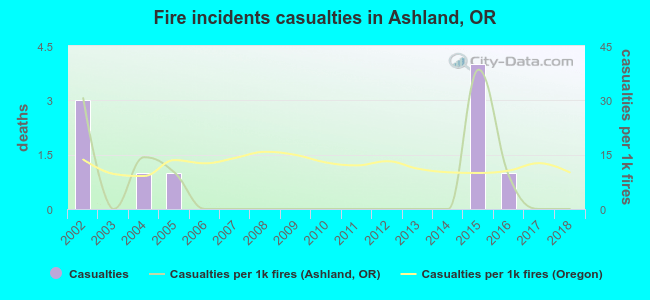 Based on the data from the years 2002 - 2018 the average number of fire-related yearly casualties is 1. The highest number of injuries - 4 took place in 2015, and the lowest - 0 in 2003. The data has a decreasing trend.
The average number of injuries per 1,000 fire incidents is 6. This indicator was the highest - 38 in 2015, and the lowest 0 in 2003. The trend for injuries per 1,000 fire incidents is decreasing. Compared to the Oregon value the number of casualties per 1,000 fires is lower.
Based on the data from the years 2002 - 2018 the average number of fire-related yearly casualties is 1. The highest number of injuries - 4 took place in 2015, and the lowest - 0 in 2003. The data has a decreasing trend.
The average number of injuries per 1,000 fire incidents is 6. This indicator was the highest - 38 in 2015, and the lowest 0 in 2003. The trend for injuries per 1,000 fire incidents is decreasing. Compared to the Oregon value the number of casualties per 1,000 fires is lower.Casualties per 1,000 incidents in Ashland, OR compared to nearest cities:
(Note: Based on data for all years, including only cities with at least 500 fire incidents)
| Ashland: | 7.5 |
| Medford: | 9.8 |
| Jacksonville: | 9.2 |
| Central Point: | 19.6 |
| White City: | 11.8 |
| Eagle Point: | 10.4 |
| Grants Pass: | 14.4 |
| Klamath Falls: | 8.1 |
| Cave Junction: | 4.9 |
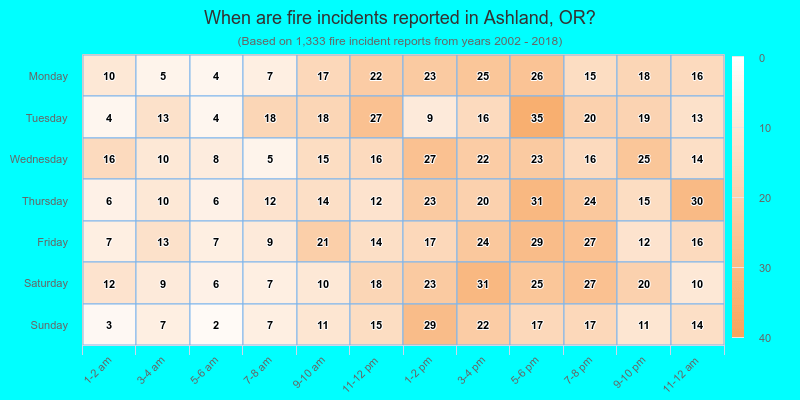
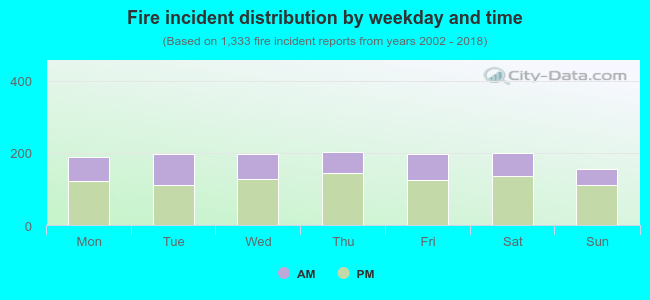 34.3% incidents where reported in the morning and 65.7% in the evening. The most fires (15.2%) took place on Thursday, and the least (11.6%) on Sunday.
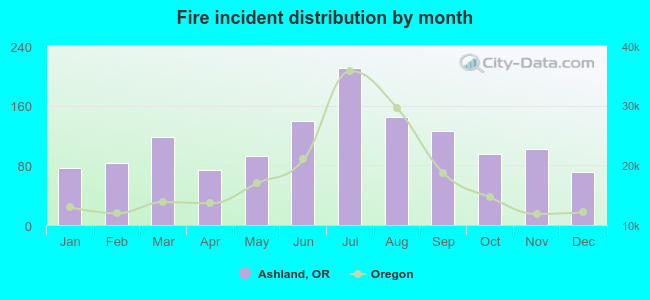 Based on the 1,333 fire incidents from years 2002 - 2018 most fires (15.8%) took place during July, and the least (5.3%) in December.
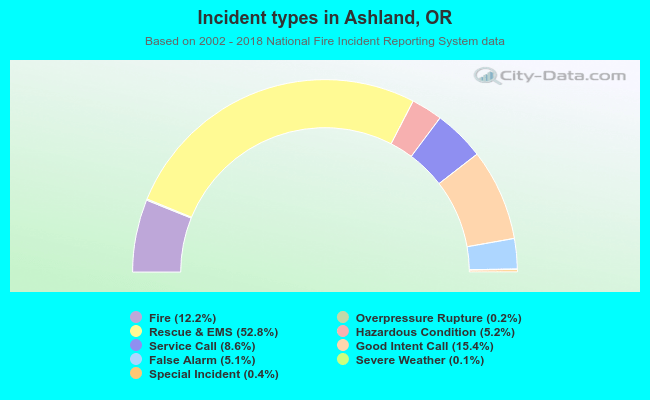 Out of all 10,929 cases reported during the years 2002 - 2018, the most belonged to the categories: Rescue & EMS (52.8%), Good Intent Call (15.4%), and Fire (12.2%).
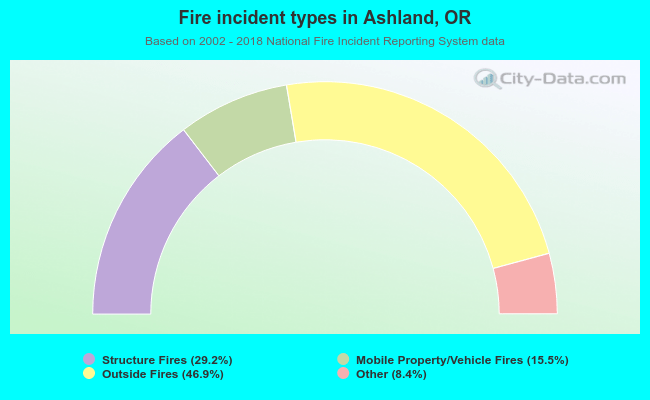 When looking into fire subcategories, the most incidents belonged to: Outside Fires (46.9%), and Structure Fires (29.2%).