Asheville: Fire Incidents, North Carolina (NC)
Where are fire incidents reported in Asheville, NC
Something went wrong! Please refresh the page.
| Fire incidents reported | |
|---|---|
| Sreet name | Count |
| TUNNEL RD | 524 |
| FRENCH BROAD AVE | 510 |
| MARKET ST | 482 |
| BARTLETT ST | 474 |
| BILTMORE AVE | 304 |
| HENDERSONVILLE RD | 288 |
| MERRIMON AVE | 266 |
| PATTON AVE | 262 |
| NEW LEICESTER HWY | 148 |
| FAIRVIEW RD | 146 |
| BREVARD RD | 144 |
| I40 | 130 |
| HAYWOOD ST | 126 |
| DEAVERVIEW RD | 122 |
| RIVERSIDE DR | 122 |
| I240 | 116 |
| HAYWOOD RD | 104 |
| SWEETEN CREEK RD | 102 |
| SMOKEY PARK HWY | 94 |
| BROADWAY ST | 86 |
| BLEACHERY BLVD | 82 |
| EMMA RD | 82 |
| BINGHAM RD | 76 |
| WOODFIN ST | 74 |
| CHARLOTTE ST | 72 |
| RICEVILLE RD | 70 |
| CRESCENT ST | 60 |
| MCDOWELL ST | 60 |
| CHARLOTTE HWY | 56 |
| COLLEGE ST | 56 |
| Other | 2,763 |
2002 - 2018 National Fire Incident Reporting System (NFIRS) incidents
- Incident types reported to NFIRS in Asheville, NC
- 54,20450.5%Rescue & EMS
- 13,03112.1%Good Intent Call
- 11,64810.9%Service Call
- 10,6609.9%False Alarm
- 8,8118.2%Hazardous Condition
- 8,0017.5%Fire
- 5170.5%Severe Weather
- 2450.2%Special Incident
- 1430.1%Overpressure Rupture
- Fire incident types reported to NFIRS in Asheville, NC
- 4,18852.3%Structure Fires
- 2,53131.6%Outside Fires
- 1,00212.5%Mobile Property/Vehicle Fires
- 2803.5%Other
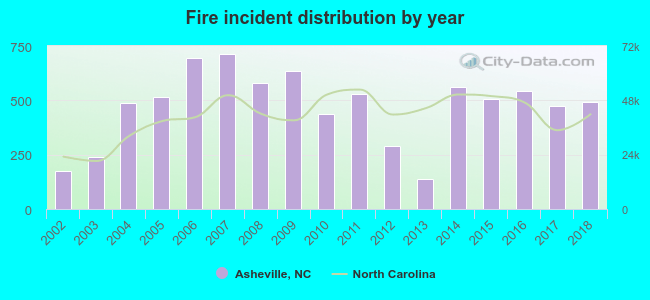 Based on the data from the years 2002 - 2018 the average number of fire incidents per year is 471. The highest number of fires - 712 took place in 2007, and the least - 136 in 2013. The data has a growing trend.
The average number of yearly fire incidents per 10k residents in Asheville, NC compared to nearest cities:
(Note: Based on data for the last 3 years, including only cities with population 5,000 and above)
| Asheville: | 57.3 |
| Woodfin: | 16.7 |
| Fletcher: | 69.5 |
| Black Mountain: | 52.0 |
| Mills River: | 33.9 |
| Etowah: | 17.3 |
| Hendersonville: | 141.4 |
| Brevard: | 130.0 |
| Waynesville: | 170.1 |
 The median response time based on all reported fire incidents is 4 minutes. This is lower compared to the North Carolina median value.
The median response time in Asheville, NC compared to nearest cities:
(Note: Based on data for all years, including only cities with at least 500 fire incidents)
| Asheville: | 4 minutes |
| Weaverville: | 7 minutes |
| Fairview: | 8 minutes |
| Swannanoa: | 8 minutes |
| Fletcher: | 7 minutes |
| Black Mountain: | 6 minutes |
| Canton: | 9 minutes |
| Marshall: | 10 minutes |
| Hendersonville: | 7 minutes |
 According to the data from the years 2002 - 2018 the average number of fire-related fatalities per year is 0. The highest number of reported deaths - 3 took place in 2005, and the lowest - 0 in 2003. The data has a decreasing trend.
The average number of fatalities per 1,000 fires is 1. This indicator was the highest - 6 in 2005, and the lowest 0 in 2003. The trend for deaths per 1,000 fire incidents is decreasing. Compared to the North Carolina value the number of fatalities per 1,000 fire incidents is lower.
According to the data from the years 2002 - 2018 the average number of fire-related fatalities per year is 0. The highest number of reported deaths - 3 took place in 2005, and the lowest - 0 in 2003. The data has a decreasing trend.
The average number of fatalities per 1,000 fires is 1. This indicator was the highest - 6 in 2005, and the lowest 0 in 2003. The trend for deaths per 1,000 fire incidents is decreasing. Compared to the North Carolina value the number of fatalities per 1,000 fire incidents is lower.Deaths per 1,000 incidents in Asheville, NC compared to nearest cities:
(Note: Based on data for all years, including only cities with at least 2,500 fire incidents)
| Asheville: | 0.9 |
| Hendersonville: | 1.7 |
| Marion: | 1.4 |
 According to the data from the years 2002 - 2018 the average number of fire-related casualties per year is 4. The highest number of reported injuries - 9 took place in 2006, and the lowest - 0 in 2011. The data has an increasing trend.
The average number of injuries per 1,000 fire incidents is 9. This indicator was the highest - 15 in 2017, and the lowest 0 in 2011. The trend for casualties per 1,000 fires is declining. Compared to the state value the number of casualties per 1,000 incidents is higher.
According to the data from the years 2002 - 2018 the average number of fire-related casualties per year is 4. The highest number of reported injuries - 9 took place in 2006, and the lowest - 0 in 2011. The data has an increasing trend.
The average number of injuries per 1,000 fire incidents is 9. This indicator was the highest - 15 in 2017, and the lowest 0 in 2011. The trend for casualties per 1,000 fires is declining. Compared to the state value the number of casualties per 1,000 incidents is higher.Casualties per 1,000 incidents in Asheville, NC compared to nearest cities:
(Note: Based on data for all years, including only cities with at least 500 fire incidents)
| Asheville: | 8.6 |
| Weaverville: | 2.3 |
| Fairview: | 1.3 |
| Swannanoa: | 4.9 |
| Fletcher: | 3.3 |
| Black Mountain: | 12.9 |
| Canton: | 10.6 |
| Marshall: | 5.8 |
| Hendersonville: | 3.7 |
 30.0% incidents where reported in the morning and 70.0% in the evening. The most fires (15.7%) took place on Saturday, and the least (13.7%) on Tuesday.
 According to the 8,001 incident reports from years 2002 - 2018 most fires (10.4%) took place during April, and the least (6.6%) in September.
 Out of all 107,260 cases reported during the years 2002 - 2018, the most belonged to the categories: Rescue & EMS (50.5%), Good Intent Call (12.1%), and Service Call (10.9%).
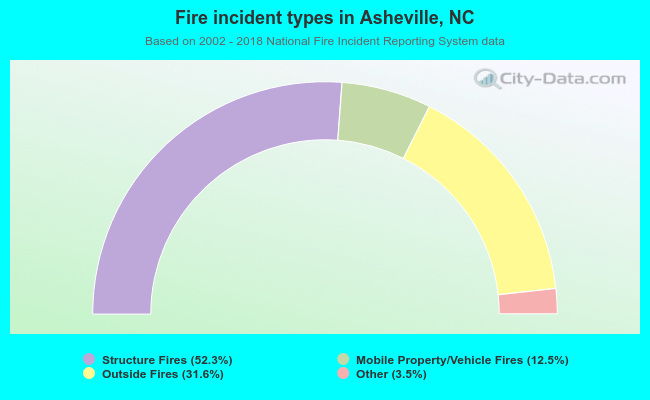 When looking into fire subcategories, the most incidents belonged to: Structure Fires (52.3%), and Outside Fires (31.6%).