Artesia: Fire Incidents, New Mexico (NM)
Where are fire incidents reported in Artesia, NM
Something went wrong! Please refresh the page.
| Fire incidents reported | |
|---|---|
| Sreet name | Count |
| MAIN ST | 66 |
| 13TH ST | 50 |
| MAIN | 42 |
| 13TH | 38 |
| 1ST ST | 32 |
| WASHINGTON AVE | 32 |
| MISSOURI AVE | 30 |
| 26TH | 28 |
| HERMOSA DR | 28 |
| OAK | 28 |
| MISSOURI | 26 |
| FREEMAN | 24 |
| ROSELAWN AVE | 24 |
| QUAY | 22 |
| RICHEY | 22 |
| US 285 | 22 |
| 285 | 20 |
| GRAND AVE | 20 |
| MILL RD | 20 |
| RICHARDSON AVE | 20 |
| CENTRE | 18 |
| GRAND | 18 |
| 1ST | 16 |
| 4TH ST | 16 |
| 7TH | 16 |
| PINE | 16 |
| 26TH ST | 14 |
| CLAYTON | 14 |
| FREEMAN AVE | 14 |
| LOLITA | 14 |
| Other | 983 |
2003 - 2018 National Fire Incident Reporting System (NFIRS) incidents
- Incident types reported to NFIRS in Artesia, NM
- 6,29067.0%Rescue & EMS
- 1,73318.4%Fire
- 4124.4%Good Intent Call
- 3984.2%Hazardous Condition
- 3874.1%False Alarm
- 1591.7%Service Call
- 130.1%Overpressure Rupture
- Fire incident types reported to NFIRS in Artesia, NM
- 94754.6%Outside Fires
- 50128.9%Structure Fires
- 1679.6%Mobile Property/Vehicle Fires
- 1186.8%Other
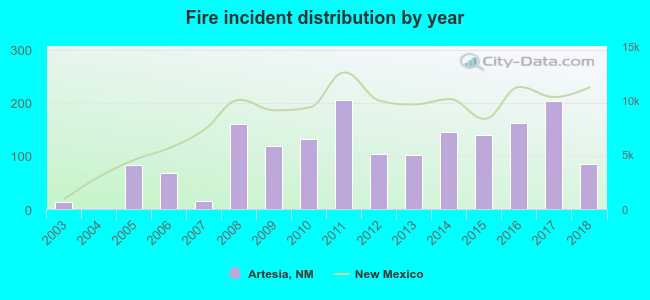 According to the data from the years 2003 - 2018 the average number of fires per year is 108. The highest number of fires - 205 took place in 2011, and the least - 0 in 2004. The data has a growing trend.
The average number of yearly fire incidents per 10k residents in Artesia, NM compared to nearest cities:
(Note: Based on data for the last 3 years, including only cities with population 5,000 and above)
| Artesia: | 126.7 |
| Carlsbad: | 79.2 |
| Roswell: | 80.2 |
| Lovington: | 71.5 |
| Hobbs: | 55.9 |
| Ruidoso: | 53.3 |
| Alamogordo: | 39.8 |
| Portales: | 111.7 |
 The median response time based on all reported fire incidents is 6 minutes. This is lower compared to the state median value.
The median response time in Artesia, NM compared to nearest cities:
(Note: Based on data for all years, including only cities with at least 500 fire incidents)
| Artesia: | 6 minutes |
| Carlsbad: | 5 minutes |
| Roswell: | 5 minutes |
| Lovington: | 7 minutes |
| Hobbs: | 5 minutes |
| Eunice: | 11 minutes |
| Jal: | 15 minutes |
| Alamogordo: | 5 minutes |
| Portales: | 7 minutes |
 30.4% incidents where reported in the morning and 69.6% in the evening. The most fires (16.2%) took place on Sunday, and the least (12.8%) on Saturday.
 According to the 1,733 reports from years 2003 - 2018 most fires (12.7%) took place during March, and the least (4.2%) in October.
 Out of all 9,394 cases reported during the years 2003 - 2018, the most belonged to the categories: Rescue & EMS (67.0%), Fire (18.4%), and Good Intent Call (4.4%).
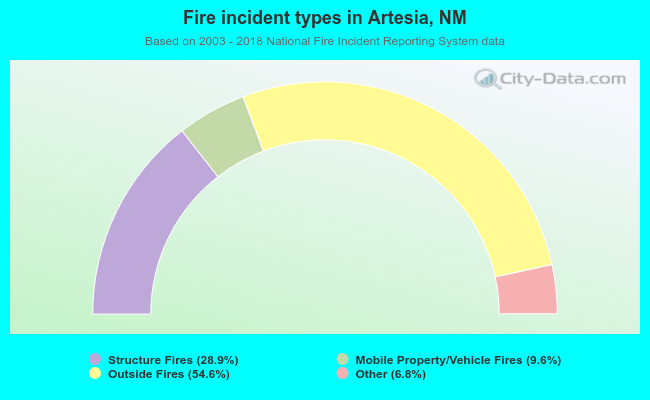 When looking into fire subcategories, the most incidents belonged to: Outside Fires (54.6%), and Structure Fires (28.9%).