Arkadelphia: Fire Incidents, Arkansas (AR)
Where are fire incidents reported in Arkadelphia, AR
Something went wrong! Please refresh the page.
|
| |||||||||||||||||||||||||||||||||||||||||||||||||||||||||||||||||||||||||||||||||||||||||||||||||||||||||||||
| Other | 561 | |||||||||||||||||||||||||||||||||||||||||||||||||||||||||||||||||||||||||||||||||||||||||||||||||||||||||||||
2002 - 2018 National Fire Incident Reporting System (NFIRS) incidents
- Incident types reported to NFIRS in Arkadelphia, AR
- 97142.1%Fire
- 52722.9%Rescue & EMS
- 40117.4%Hazardous Condition
- 1687.3%Service Call
- 1235.3%False Alarm
- 994.3%Good Intent Call
- 80.3%Severe Weather
- 70.3%Overpressure Rupture
- Fire incident types reported to NFIRS in Arkadelphia, AR
- 41943.2%Outside Fires
- 33434.4%Structure Fires
- 18619.2%Mobile Property/Vehicle Fires
- 323.3%Other
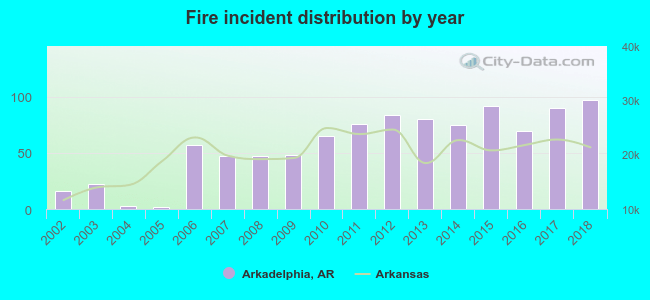 According to the data from the years 2002 - 2018 the average number of fire incidents per year is 57. The highest number of reported fire incidents - 97 took place in 2018, and the least - 2 in 2005. The data has an increasing trend.
The average number of yearly fire incidents per 10k residents in Arkadelphia, AR compared to nearest cities:
(Note: Based on data for the last 3 years, including only cities with population 5,000 and above)
| Arkadelphia: | 80.4 |
| Malvern: | 210.6 |
| Hot Springs: | 127.3 |
| Hot Springs Village: | 27.8 |
| Camden: | 110.9 |
| Benton: | 96.6 |
| Hope: | 121.6 |
| Bryant: | 54.2 |
| East End: | 1.4 |
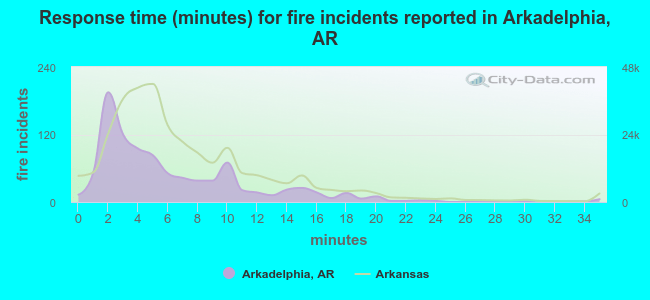 The median response time based on all reported fire incidents is 5 minutes. This is lower compared to the state median value.
The median response time in Arkadelphia, AR compared to nearest cities:
(Note: Based on data for all years, including only cities with at least 500 fire incidents)
| Arkadelphia: | 5 minutes |
| Malvern: | 6 minutes |
| Hot Springs: | 5 minutes |
| Sheridan: | 10 minutes |
| Camden: | 5 minutes |
| Benton: | 6 minutes |
| Fordyce: | 4 minutes |
| Hope: | 4 minutes |
| Bauxite: | 10 minutes |
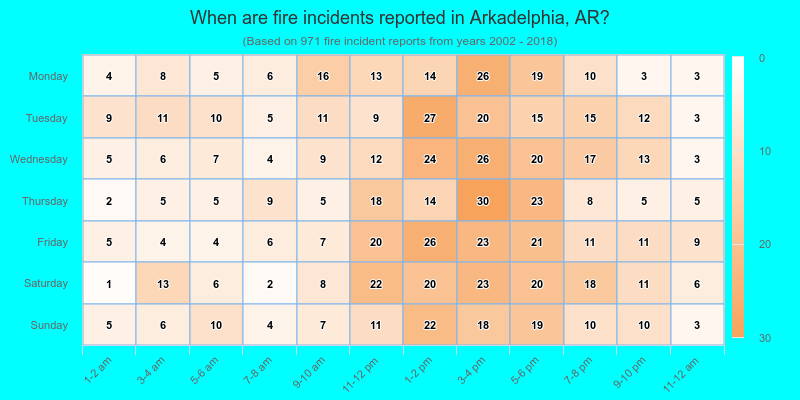
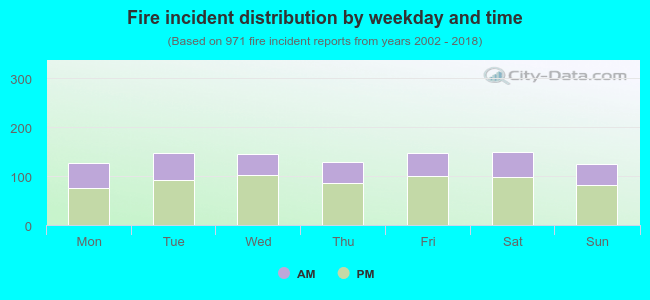 34.5% incidents where reported in the morning and 65.5% in the evening. The most fires (15.4%) took place on Saturday, and the least (12.9%) on Sunday.
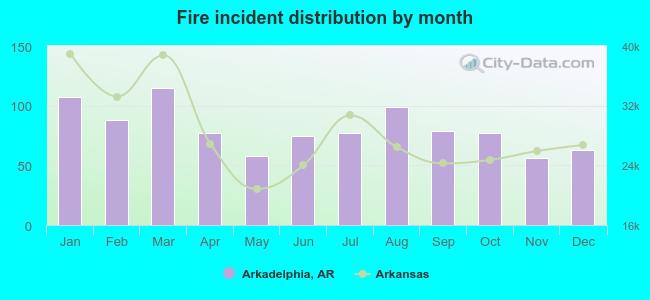 Based on the 971 incident reports from years 2002 - 2018 most fires (11.8%) took place during March, and the least (5.8%) in November.
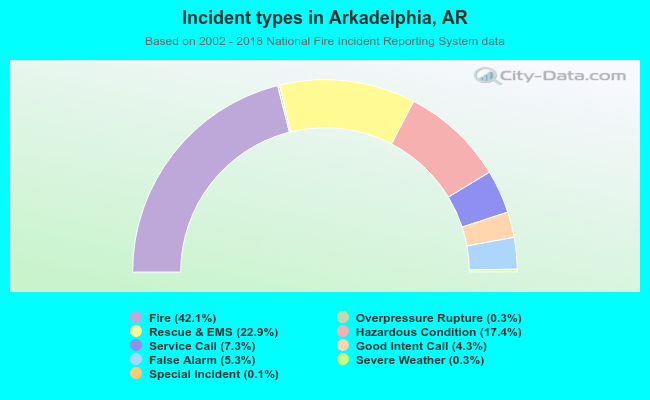 Out of all 2,306 cases reported during the years 2002 - 2018, the most belonged to the categories: Fire (42.1%), Rescue & EMS (22.9%), and Hazardous Condition (17.4%).
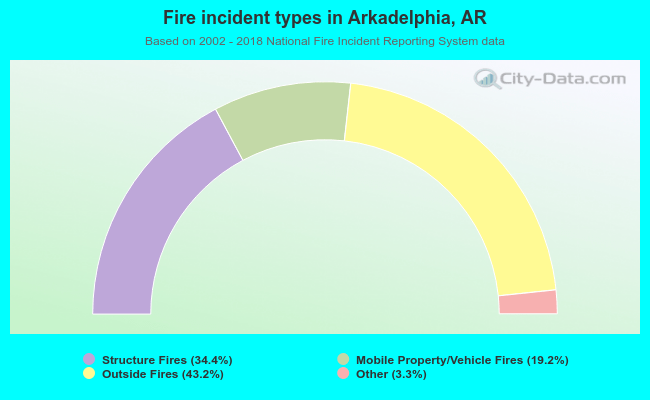 When looking into fire subcategories, the most incidents belonged to: Outside Fires (43.2%), and Structure Fires (34.4%).