Ardmore: Fire Incidents, Pennsylvania (PA)
Where are fire incidents reported in Ardmore, PA
Something went wrong! Please refresh the page.
|
| |||||||||||||||||||||||||||||||||||||||||||||||||||||||||||||||||||||||||||||||||||||||||||||||||||||||||||||
2003 - 2018 National Fire Incident Reporting System (NFIRS) incidents
- Incident types reported to NFIRS in Ardmore, PA
- 24034.3%Hazardous Condition
- 22632.3%Fire
- 13319.0%False Alarm
- 699.9%Good Intent Call
- 172.4%Service Call
- 142.0%Rescue & EMS
- 10.1%Severe Weather
- Fire incident types reported to NFIRS in Ardmore, PA
- 14463.7%Structure Fires
- 6026.5%Outside Fires
- 208.8%Mobile Property/Vehicle Fires
- 20.9%Other
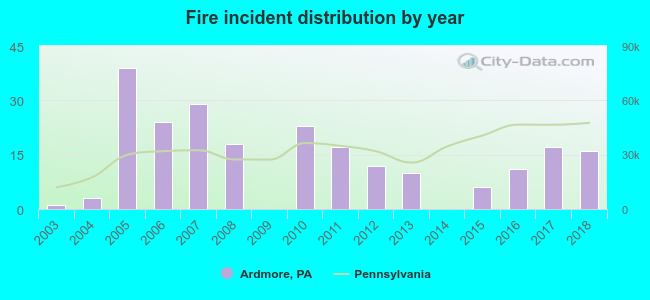 According to the data from the years 2003 - 2018 the average number of fires per year is 14. The highest number of reported fire incidents - 39 took place in 2005, and the least - 0 in 2009. The data has an increasing trend.
The average number of yearly fire incidents per 10k residents in Ardmore, PA compared to nearest cities:
(Note: Based on data for the last 3 years, including only cities with population 5,000 and above)
| Ardmore: | 11.8 |
| Drexel Hill: | 16.8 |
| Broomall: | 53.4 |
| Lansdowne: | 63.3 |
| Clifton Heights: | 46.0 |
| Conshohocken: | 65.9 |
| Yeadon: | 98.3 |
| Springfield: | 14.6 |
| Darby: | 116.6 |
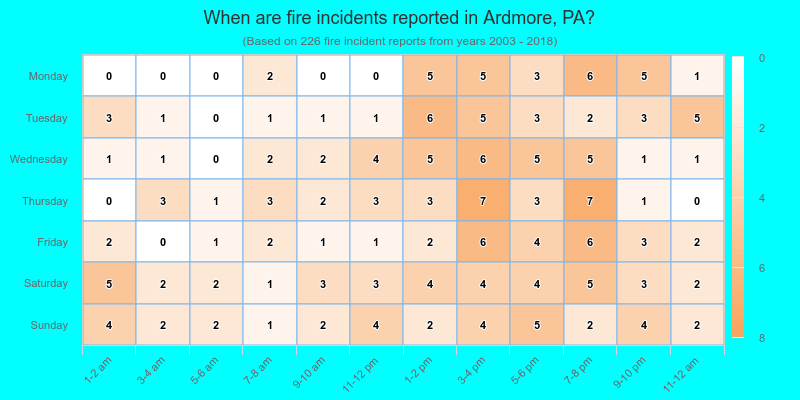
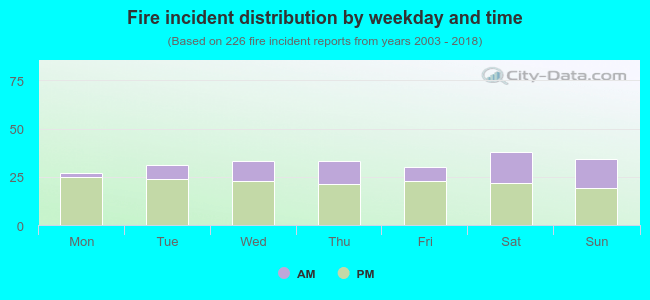 30.5% incidents where reported in the morning and 69.5% in the evening. The most fires (16.8%) took place on Saturday, and the least (11.9%) on Monday.
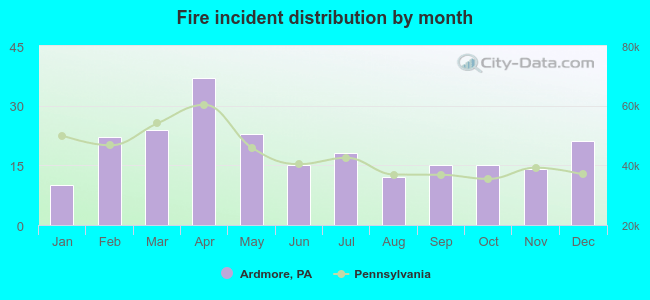 Based on the 226 fire incident reports from years 2003 - 2018 most fires (16.4%) took place during April, and the least (4.4%) in January.
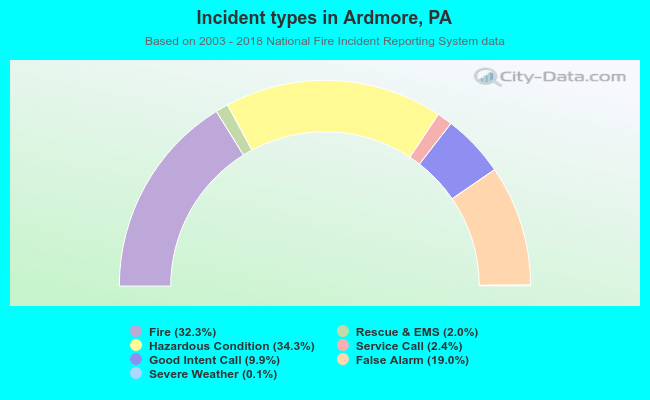 Out of all 700 cases reported during the years 2003 - 2018, the most belonged to the categories: Rescue & EMS (34.3%), Fire (32.3%), and Good Intent Call (19.0%).
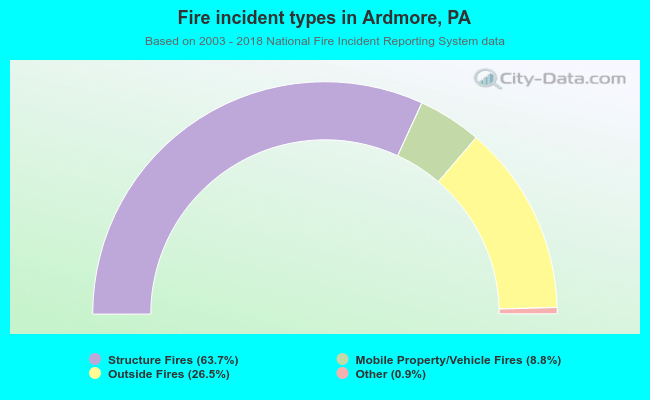 When looking into fire subcategories, the most reports belonged to: Structure Fires (63.7%), and Outside Fires (26.5%).