Apache Junction: Fire Incidents, Arizona (AZ)
Where are fire incidents reported in Apache Junction, AZ
Something went wrong! Please refresh the page.
| Fire incidents reported | |
|---|---|
| Sreet name | Count |
| APACHE TRL | 198 |
| IRONWOOD DR | 174 |
| US 60 HWY | 114 |
| SUPERSTITION BLVD | 84 |
| BROADWAY AVE | 80 |
| IDAHO RD | 74 |
| SOUTHERN AVE | 62 |
| WARNER DR | 54 |
| DELAWARE DR | 50 |
| TOMAHAWK RD | 48 |
| 4TH AVE | 42 |
| GOLD DR | 40 |
| KINGS RANCH RD | 38 |
| OLD WEST HWY | 38 |
| BASELINE AVE | 34 |
| LOST DUTCHMAN BLVD | 34 |
| 16TH AVE | 32 |
| LAWSON DR | 30 |
| ROYAL PALM RD | 30 |
| CEDAR DR | 28 |
| GOLDFIELD RD | 28 |
| SAGUARO DR | 28 |
| MCKELLIPS BLVD | 26 |
| MOUNTAIN VIEW RD | 26 |
| CACTUS RD | 24 |
| 60 SUPERSTITION FRWY | 22 |
| MAIN DR | 22 |
| MERIDIAN DR | 22 |
| 26TH AVE | 20 |
| CORTEZ RD | 20 |
2003 - 2018 National Fire Incident Reporting System (NFIRS) incidents
- Incident types reported to NFIRS in Apache Junction, AZ
- 1,51624.8%Rescue & EMS
- 1,36922.4%Fire
- 1,30321.3%Service Call
- 1,21219.8%Good Intent Call
- 4597.5%Hazardous Condition
- 1712.8%False Alarm
- 701.1%Special Incident
- Fire incident types reported to NFIRS in Apache Junction, AZ
- 67549.3%Outside Fires
- 35926.2%Structure Fires
- 26519.4%Mobile Property/Vehicle Fires
- 705.1%Other
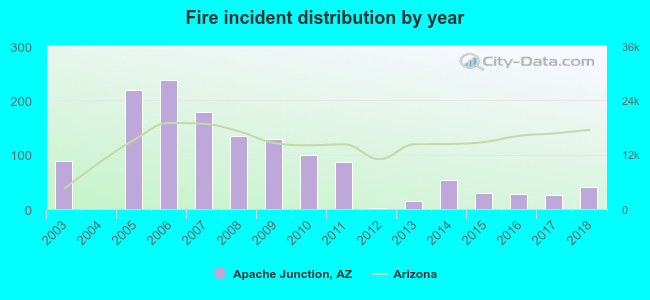 According to the data from the years 2003 - 2018 the average number of fire incidents per year is 86. The highest number of fire incidents - 238 took place in 2006, and the least - 0 in 2004. The data has a decreasing trend.
The average number of yearly fire incidents per 10k residents in Apache Junction, AZ compared to nearest cities:
(Note: Based on data for the last 3 years, including only cities with population 5,000 and above)
| Apache Junction: | 8.3 |
| Mesa: | 21.6 |
| Queen Creek: | 21.4 |
| Gilbert: | 12.8 |
| San Tan Valley: | 0.3 |
| Salt River: | 1.1 |
| Chandler: | 16.6 |
| Tempe: | 29.2 |
| Sun Lakes: | 19.1 |
 The median response time based on all reported fire incidents is 6 minutes. This is close to the Arizona median value.
The median response time in Apache Junction, AZ compared to nearest cities:
(Note: Based on data for all years, including only cities with at least 500 fire incidents)
| Apache Junction: | 6 minutes |
| Mesa: | 5 minutes |
| Queen Creek: | 6 minutes |
| Gilbert: | 5 minutes |
| Chandler: | 5 minutes |
| Tempe: | 4 minutes |
| Scottsdale: | 5 minutes |
| Florence: | 7 minutes |
| Coolidge: | 6 minutes |
 According to the reports from the years 2003 - 2018 the average number of fire-related yearly casualties is 2. The highest number of injuries - 13 took place in 2007, and the lowest - 0 in 2003. The data has a constant trend.
The average number of injuries per 1,000 fire incidents is 15. This indicator was the highest - 73 in 2007, and the lowest 0 in 2003. The trend for casualties per 1,000 fire incidents is constant. Compared to the Arizona value the number of casualties per 1,000 fire incidents is much higher.
According to the reports from the years 2003 - 2018 the average number of fire-related yearly casualties is 2. The highest number of injuries - 13 took place in 2007, and the lowest - 0 in 2003. The data has a constant trend.
The average number of injuries per 1,000 fire incidents is 15. This indicator was the highest - 73 in 2007, and the lowest 0 in 2003. The trend for casualties per 1,000 fire incidents is constant. Compared to the Arizona value the number of casualties per 1,000 fire incidents is much higher.Casualties per 1,000 incidents in Apache Junction, AZ compared to nearest cities:
(Note: Based on data for all years, including only cities with at least 500 fire incidents)
| Apache Junction: | 25.6 |
| Mesa: | 15.7 |
| Queen Creek: | 1.5 |
| Gilbert: | 5.0 |
| Chandler: | 1.8 |
| Tempe: | 8.7 |
| Scottsdale: | 2.6 |
| Florence: | 1.7 |
| Coolidge: | 5.1 |
 34.0% incidents where reported in the morning and 66.0% in the evening. The most fires (15.9%) took place on Saturday, and the least (12.2%) on Wednesday.
 Based on the 1,369 fire incidents from years 2003 - 2018 most fires (11.3%) took place during June, and the least (5.8%) in December.
 Out of all 6,106 cases reported during the years 2003 - 2018, the most belonged to the categories: Rescue & EMS (24.8%), Fire (22.4%), and Service Call (21.3%).
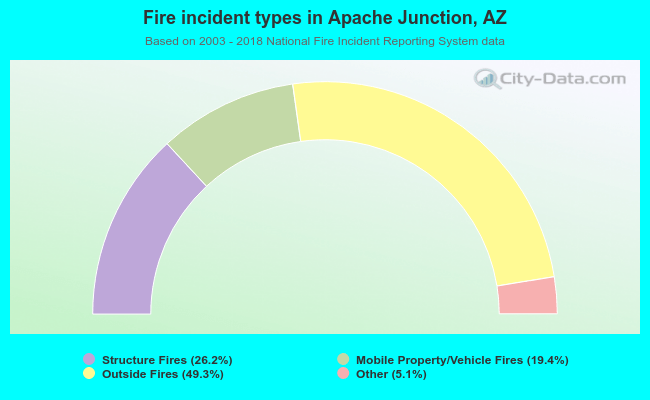 When looking into fire subcategories, the most incidents belonged to: Outside Fires (49.3%), and Structure Fires (26.2%).