Crime rate in Tucson, Arizona (AZ): murders, rapes, robberies, assaults, burglaries, thefts, auto thefts, arson, law enforcement employees, police officers, crime map
Crime rate in Tucson, AZ
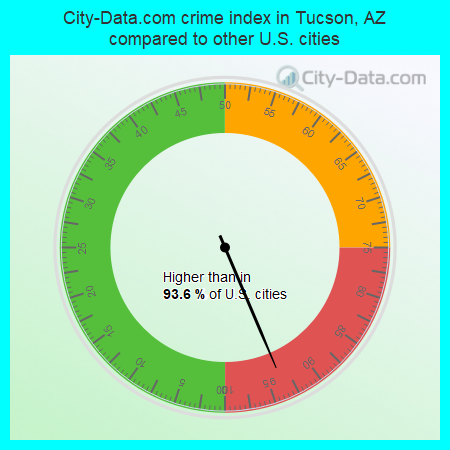
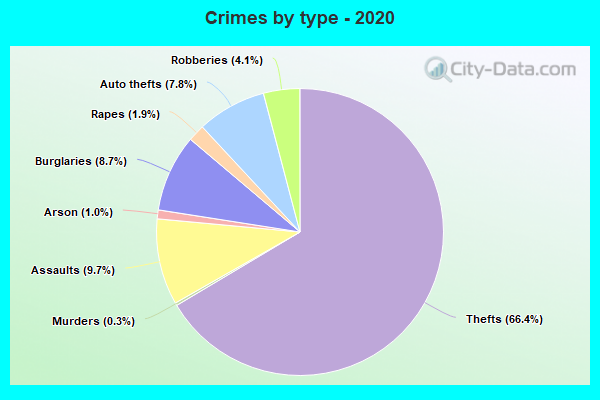
The 2020 crime rate in Tucson, AZ is 398 (City-Data.com crime index), which is 1.6 times higher than the U.S. average. It was higher than in 93.6% U.S. cities. The 2020 Tucson crime rate rose by 2% compared to 2019. The number of homicides stood at 61 - an increase of 21 compared to 2019. In the last 5 years Tucson has seen decreasing violent crime and decreasing property crime.See how dangerous Tucson, AZ is compared to the nearest cities:
(Note: Higher means more crime)
(Note: Higher means more crime)
| Tucson: | 397.7 |
| South Tucson: | 1,231.4 |
| Oro Valley: | 68.1 |
| Marana: | 124.7 |
| Sahuarita: | 72.4 |
| Mammoth: | 316.3 |
| Benson: | 177.7 |
| Huachuca City: | 74.0 |
| Hayden: | 192.6 |
The City-Data.com crime index weighs serious crimes and violent crimes more heavily. Higher means more crime, U.S. average is 246.1. It adjusts for the number of visitors and daily workers commuting into cities.
- means the value is smaller than the state average.- means the value is about the same as the state average.
- means the value is bigger than the state average.
- means the value is much bigger than the state average.
According to our research of Arizona and other state lists, there were 1,384 registered sex offenders living in Tucson, Arizona as of May 23, 2024.
The ratio of all residents to sex offenders in Tucson is 383 to 1.
Violent crime rate in 2020
| Tucson: | 407.8 |
| U.S. Average: | 228.2 |
Violent crime rate in 2019
| Tucson: | 403.2 |
| U.S. Average: | 219.9 |
Violent crime rate in 2018
| Tucson: | 428.3 |
| U.S. Average: | 221.2 |
Violent crime rate in 2017
| Tucson: | 460.6 |
| U.S. Average: | 226.2 |
Violent crime rate in 2016
| Tucson: | 450.1 |
| U.S. Average: | 227.3 |
Violent crime rate in 2015
| Tucson: | 376.4 |
| U.S. Average: | 219.3 |
Violent crime rate in 2014
| Tucson: | 374.2 |
| U.S. Average: | 211.1 |
Violent crime rate in 2013
| Tucson: | 354.4 |
| U.S. Average: | 214.2 |
Violent crime rate in 2012
| Tucson: | 396.0 |
| U.S. Average: | 187.4 |
Violent crime rate in 2011
| Tucson: | 359.9 |
| U.S. Average: | 187.1 |
Violent crime rate in 2010
| Tucson: | 350.1 |
| U.S. Average: | 195.7 |
Violent crime rate in 2009
| Tucson: | 353.0 |
| U.S. Average: | 208.9 |
Violent crime rate in 2008
| Tucson: | 443.6 |
| U.S. Average: | 222.5 |
Violent crime rate in 2007
| Tucson: | 324.2 |
| U.S. Average: | 229.1 |
Violent crime rate in 2006
| Tucson: | 352.0 |
| U.S. Average: | 232.6 |
Violent crime rate in 2005
| Tucson: | 395.8 |
| U.S. Average: | 227.0 |
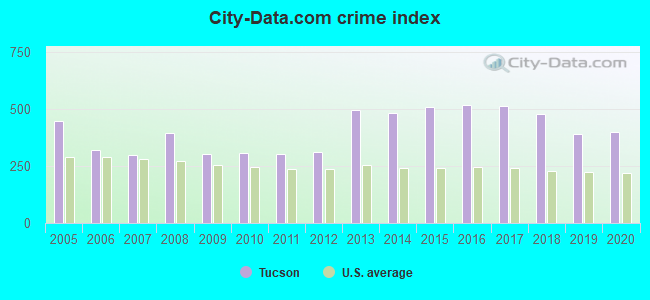
Property crime rate in 2020
| Tucson: | 272.3 |
| U.S. Average: | 169.6 |
Property crime rate in 2019
| Tucson: | 272.9 |
| U.S. Average: | 179.7 |
Property crime rate in 2018
| Tucson: | 386.4 |
| U.S. Average: | 190.2 |
Property crime rate in 2017
| Tucson: | 432.5 |
| U.S. Average: | 206.4 |
Property crime rate in 2016
| Tucson: | 445.6 |
| U.S. Average: | 216.6 |
Property crime rate in 2015
| Tucson: | 472.3 |
| U.S. Average: | 221.5 |
Property crime rate in 2014
| Tucson: | 455.0 |
| U.S. Average: | 230.8 |
Property crime rate in 2013
| Tucson: | 512.3 |
| U.S. Average: | 250.4 |
Property crime rate in 2012
| Tucson: | 259.4 |
| U.S. Average: | 267.3 |
Property crime rate in 2011
| Tucson: | 266.9 |
| U.S. Average: | 273.5 |
Property crime rate in 2010
| Tucson: | 291.3 |
| U.S. Average: | 276.4 |
Property crime rate in 2009
| Tucson: | 282.3 |
| U.S. Average: | 285.6 |
Property crime rate in 2008
| Tucson: | 359.7 |
| U.S. Average: | 302.2 |
Property crime rate in 2007
| Tucson: | 282.5 |
| U.S. Average: | 309.2 |
Property crime rate in 2006
| Tucson: | 298.4 |
| U.S. Average: | 317.3 |
Property crime rate in 2005
| Tucson: | 422.9 |
| U.S. Average: | 322.3 |

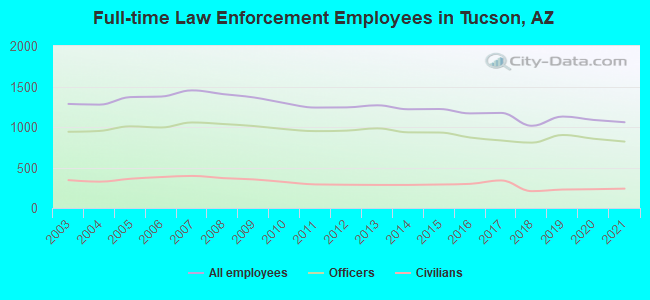
Full-time law enforcement employees in 2021, including police officers: 1,059 (820 officers - 696 male; 124 female).
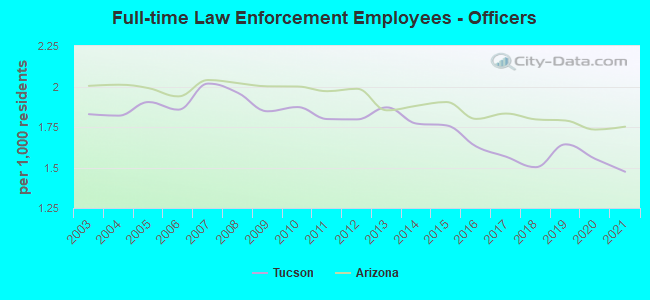
| Officers per 1,000 residents here: | 1.47 |
| Arizona average: | 1.75 |
Full-time law enforcement employees in 2020, including police officers: 1,087 (855 officers - 732 male; 123 female).
| Officers per 1,000 residents here: | 1.55 |
| Arizona average: | 1.73 |
Full-time law enforcement employees in 2019, including police officers: 1,129 (901 officers - 772 male; 129 female).
| Officers per 1,000 residents here: | 1.64 |
| Arizona average: | 1.79 |
Full-time law enforcement employees in 2018, including police officers: 1,015 (807 officers - 692 male; 115 female).
| Officers per 1,000 residents here: | 1.50 |
| Arizona average: | 1.80 |
Full-time law enforcement employees in 2017, including police officers: 1,174 (834 officers - 718 male; 116 female).
| Officers per 1,000 residents here: | 1.57 |
| Arizona average: | 1.83 |
Full-time law enforcement employees in 2016, including police officers: 1,168 (870 officers - 750 male; 120 female).
| Officers per 1,000 residents here: | 1.63 |
| Arizona average: | 1.80 |
Full-time law enforcement employees in 2015, including police officers: 1,222 (932 officers - 796 male; 136 female).
| Officers per 1,000 residents here: | 1.76 |
| Arizona average: | 1.90 |
Full-time law enforcement employees in 2014, including police officers: 1,219 (934 officers - 799 male; 135 female).
| Officers per 1,000 residents here: | 1.77 |
| Arizona average: | 1.88 |
Full-time law enforcement employees in 2013, including police officers: 1,268 (983 officers - 840 male; 143 female).
| Officers per 1,000 residents here: | 1.87 |
| Arizona average: | 1.85 |
Full-time law enforcement employees in 2012, including police officers: 1,242 (955 officers - 815 male; 140 female).
| Officers per 1,000 residents here: | 1.80 |
| Arizona average: | 1.99 |
Full-time law enforcement employees in 2011, including police officers: 1,240 (949 officers - 812 male; 137 female).
| Officers per 1,000 residents here: | 1.80 |
| Arizona average: | 1.97 |
Full-time law enforcement employees in 2010, including police officers: 1,295 (974 officers - 830 male; 144 female).
| Officers per 1,000 residents here: | 1.87 |
| Arizona average: | 2.00 |
Full-time law enforcement employees in 2009, including police officers: 1,365 (1,012 officers - 865 male; 147 female).
| Officers per 1,000 residents here: | 1.85 |
| Arizona average: | 2.00 |
Full-time law enforcement employees in 2008, including police officers: 1,406 (1,037 officers - 883 male; 154 female).
| Officers per 1,000 residents here: | 1.96 |
| Arizona average: | 2.02 |
Full-time law enforcement employees in 2007, including police officers: 1,452 (1,056 officers - 899 male; 157 female).
| Officers per 1,000 residents here: | 2.02 |
| Arizona average: | 2.04 |
Full-time law enforcement employees in 2006, including police officers: 1,376 (994 officers - 848 male; 146 female).
| Officers per 1,000 residents here: | 1.86 |
| Arizona average: | 1.94 |
Full-time law enforcement employees in 2005, including police officers: 1,369 (1,008 officers - 860 male; 148 female).
| Officers per 1,000 residents here: | 1.90 |
| Arizona average: | 1.99 |
Full-time law enforcement employees in 2004, including police officers: 1,276 (951 officers - 811 male; 140 female).
| Officers per 1,000 residents here: | 1.82 |
| Arizona average: | 2.01 |
Full-time law enforcement employees in 2003, including police officers: 1,285 (941 officers - 797 male; 144 female).
| Officers per 1,000 residents here: | 1.83 |
| Arizona average: | 2.00 |


Zip codes: 85701, 85706, 85707, 85708, 85710, 85711, 85714, 85719, 85723, 85724, 85726, 85730, 85745.