Crime rate in Springfield, Illinois (IL): murders, rapes, robberies, assaults, burglaries, thefts, auto thefts, arson, law enforcement employees, police officers, crime map
Crime rate in Springfield, IL
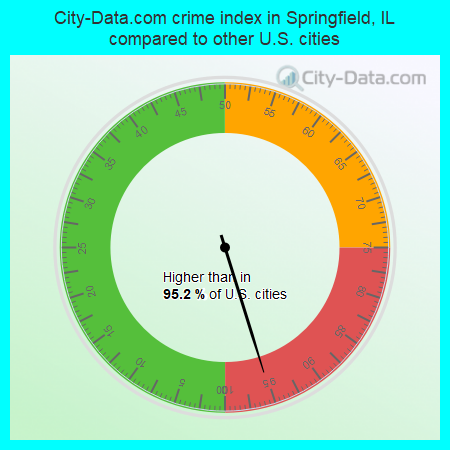
The 2022 crime rate in Springfield, IL is 442 (City-Data.com crime index), which is 1.8 times greater than the U.S. average. It was higher than in 95.4% U.S. cities. The 2022 Springfield crime rate rose by 3% compared to 2021. The number of homicides stood at 7 - a decrease of 4 compared to 2021. In the last 5 years Springfield has seen decline of violent crime and decline of property crime.See how dangerous Springfield, IL is compared to the nearest cities:
(Note: Higher means more crime)
(Note: Higher means more crime)
| Springfield: | 441.5 |
| Jerome: | 105.8 |
| Leland Grove: | 5.4 |
| Southern View: | 290.4 |
| Grandview: | 144.2 |
| Rochester: | 69.5 |
| Riverton: | 201.2 |
| Sherman: | 15.4 |
| Chatham: | 54.4 |
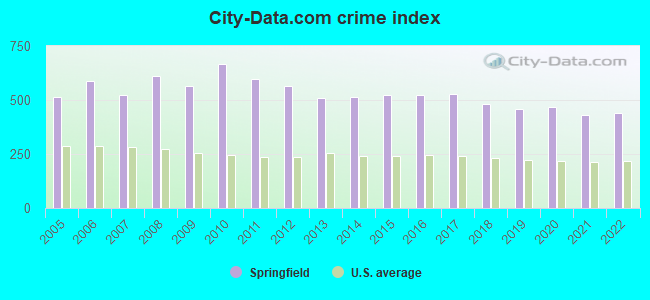
The City-Data.com crime index weighs serious crimes and violent crimes more heavily. Higher means more crime, U.S. average is 246.1. It adjusts for the number of visitors and daily workers commuting into cities.
- means the value is smaller than the state average.- means the value is about the same as the state average.
- means the value is bigger than the state average.
- means the value is much bigger than the state average.
According to our research of Illinois and other state lists, there were 404 registered sex offenders living in Springfield, Illinois as of May 23, 2024.
The ratio of all residents to sex offenders in Springfield is 287 to 1.

Violent crime rate in 2022
| Springfield: | 437.1 |
| U.S. Average: | 219.8 |
Violent crime rate in 2021
| Springfield: | 470.7 |
| U.S. Average: | 224.8 |
Violent crime rate in 2020
| Springfield: | 532.0 |
| U.S. Average: | 228.2 |
Violent crime rate in 2019
| Springfield: | 447.6 |
| U.S. Average: | 219.9 |
Violent crime rate in 2018
| Springfield: | 468.9 |
| U.S. Average: | 221.2 |
Violent crime rate in 2017
| Springfield: | 578.4 |
| U.S. Average: | 226.2 |
Violent crime rate in 2016
| Springfield: | 608.3 |
| U.S. Average: | 227.3 |
Violent crime rate in 2015
| Springfield: | 593.4 |
| U.S. Average: | 219.3 |
Violent crime rate in 2014
| Springfield: | 579.3 |
| U.S. Average: | 211.1 |
Violent crime rate in 2013
| Springfield: | 543.2 |
| U.S. Average: | 214.2 |
Violent crime rate in 2012
| Springfield: | 556.2 |
| U.S. Average: | 187.4 |
Violent crime rate in 2011
| Springfield: | 585.3 |
| U.S. Average: | 187.1 |
Violent crime rate in 2010
| Springfield: | 678.3 |
| U.S. Average: | 195.7 |
Violent crime rate in 2009
| Springfield: | 590.0 |
| U.S. Average: | 208.9 |
Violent crime rate in 2008
| Springfield: | 700.6 |
| U.S. Average: | 222.5 |
Violent crime rate in 2007
| Springfield: | 600.7 |
| U.S. Average: | 229.1 |
Violent crime rate in 2006
| Springfield: | 634.2 |
| U.S. Average: | 232.6 |
Violent crime rate in 2005
| Springfield: | 576.9 |
| U.S. Average: | 227.0 |
Property crime rate in 2022
| Springfield: | 378.4 |
| U.S. Average: | 166.5 |
Property crime rate in 2021
| Springfield: | 328.7 |
| U.S. Average: | 157.8 |
Property crime rate in 2020
| Springfield: | 341.7 |
| U.S. Average: | 169.6 |
Property crime rate in 2019
| Springfield: | 381.4 |
| U.S. Average: | 179.7 |
Property crime rate in 2018
| Springfield: | 417.4 |
| U.S. Average: | 190.2 |
Property crime rate in 2017
| Springfield: | 421.9 |
| U.S. Average: | 206.4 |
Property crime rate in 2016
| Springfield: | 401.6 |
| U.S. Average: | 216.6 |
Property crime rate in 2015
| Springfield: | 389.3 |
| U.S. Average: | 221.5 |
Property crime rate in 2014
| Springfield: | 389.1 |
| U.S. Average: | 230.8 |
Property crime rate in 2013
| Springfield: | 432.4 |
| U.S. Average: | 250.4 |
Property crime rate in 2012
| Springfield: | 525.4 |
| U.S. Average: | 267.3 |
Property crime rate in 2011
| Springfield: | 568.6 |
| U.S. Average: | 273.5 |
Property crime rate in 2010
| Springfield: | 625.7 |
| U.S. Average: | 276.4 |
Property crime rate in 2009
| Springfield: | 544.3 |
| U.S. Average: | 285.6 |
Property crime rate in 2008
| Springfield: | 553.0 |
| U.S. Average: | 302.2 |
Property crime rate in 2007
| Springfield: | 449.8 |
| U.S. Average: | 309.2 |
Property crime rate in 2006
| Springfield: | 510.6 |
| U.S. Average: | 317.3 |
Property crime rate in 2005
| Springfield: | 480.0 |
| U.S. Average: | 322.3 |


Full-time law enforcement employees in 2021, including police officers: 239 (216 officers - 185 male; 31 female).
| Officers per 1,000 residents here: | 1.91 |
| Illinois average: | 2.84 |
Full-time law enforcement employees in 2020, including police officers: 257 (229 officers - 198 male; 31 female).
| Officers per 1,000 residents here: | 2.01 |
| Illinois average: | 3.04 |
Full-time law enforcement employees in 2019, including police officers: 269 (241 officers - 210 male; 31 female).
| Officers per 1,000 residents here: | 2.11 |
| Illinois average: | 3.06 |
Full-time law enforcement employees in 2018, including police officers: 268 (239 officers - 209 male; 30 female).
| Officers per 1,000 residents here: | 2.09 |
| Illinois average: | 3.21 |
Full-time law enforcement employees in 2017, including police officers: 267 (238 officers - 211 male; 27 female).
| Officers per 1,000 residents here: | 2.06 |
| Illinois average: | 3.15 |
Full-time law enforcement employees in 2016, including police officers: 268 (241 officers - 215 male; 26 female).
| Officers per 1,000 residents here: | 2.07 |
| Illinois average: | 3.16 |
Full-time law enforcement employees in 2015, including police officers: 270 (241 officers - 214 male; 27 female).
| Officers per 1,000 residents here: | 2.06 |
| Illinois average: | 2.42 |
Full-time law enforcement employees in 2014, including police officers: 267 (232 officers - 205 male; 27 female).
| Officers per 1,000 residents here: | 1.98 |
| Illinois average: | 3.28 |
Full-time law enforcement employees in 2013, including police officers: 278 (239 officers - 210 male; 29 female).
| Officers per 1,000 residents here: | 2.04 |
| Illinois average: | 2.23 |
Full-time law enforcement employees in 2012, including police officers: 287 (249 officers - 221 male; 28 female).
| Officers per 1,000 residents here: | 2.13 |
| Illinois average: | 2.76 |
Full-time law enforcement employees in 2011, including police officers: 279 (240 officers - 213 male; 27 female).
| Officers per 1,000 residents here: | 2.06 |
| Illinois average: | 2.78 |
Full-time law enforcement employees in 2010, including police officers: 293 (251 officers - 224 male; 27 female).
| Officers per 1,000 residents here: | 2.16 |
| Illinois average: | 2.78 |
Full-time law enforcement employees in 2009, including police officers: 317 (268 officers - 238 male; 30 female).
| Officers per 1,000 residents here: | 2.27 |
| Illinois average: | 2.86 |
Full-time law enforcement employees in 2008, including police officers: 318 (269 officers - 238 male; 31 female).
| Officers per 1,000 residents here: | 2.28 |
| Illinois average: | 2.91 |
Full-time law enforcement employees in 2007, including police officers: 314 (267 officers - 239 male; 28 female).
| Officers per 1,000 residents here: | 2.28 |
| Illinois average: | 2.92 |
Full-time law enforcement employees in 2006, including police officers: 314 (271 officers - 243 male; 28 female).
| Officers per 1,000 residents here: | 2.33 |
| Illinois average: | 2.92 |
Full-time law enforcement employees in 2005, including police officers: 314 (268 officers - 244 male; 24 female).
| Officers per 1,000 residents here: | 2.33 |
| Illinois average: | 2.87 |
Full-time law enforcement employees in 2004, including police officers: 319 (270 officers - 244 male; 26 female).
| Officers per 1,000 residents here: | 2.37 |
| Illinois average: | 2.88 |
Full-time law enforcement employees in 2003, including police officers: 317 (270 officers - 245 male; 25 female).
| Officers per 1,000 residents here: | 2.40 |
| Illinois average: | 2.90 |


