Crime rate in Sioux Falls, South Dakota (SD): murders, rapes, robberies, assaults, burglaries, thefts, auto thefts, arson, law enforcement employees, police officers, crime map
Crime rate in Sioux Falls, SD
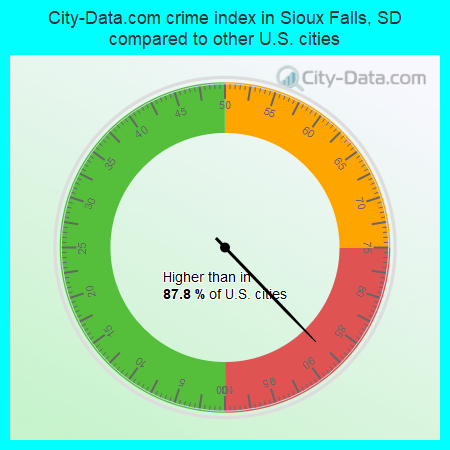
The 2022 crime rate in Sioux Falls, SD is 301 (City-Data.com crime index), which is 1.2 times higher than the U.S. average. It was higher than in 87.8% U.S. cities. The 2022 Sioux Falls crime rate rose by 4% compared to 2021. The number of homicides stood at 7 - an increase of 4 compared to 2021. In the last 5 years Sioux Falls has seen rise of violent crime and rise of property crime.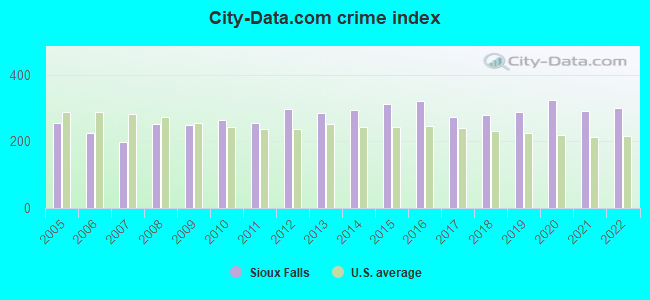
The City-Data.com crime index weighs serious crimes and violent crimes more heavily. Higher means more crime, U.S. average is 246.1. It adjusts for the number of visitors and daily workers commuting into cities.
- means the value is smaller than the state average.- means the value is about the same as the state average.
- means the value is bigger than the state average.
- means the value is much bigger than the state average.
According to our research of South Dakota and other state lists, there were 1,251 registered sex offenders living in Sioux Falls, South Dakota as of May 23, 2024.
The ratio of all residents to sex offenders in Sioux Falls is 136 to 1.
Violent crime rate in 2022
| Sioux Falls: | 297.2 |
| U.S. Average: | 219.8 |
Violent crime rate in 2021
| Sioux Falls: | 297.6 |
| U.S. Average: | 224.8 |
Violent crime rate in 2020
| Sioux Falls: | 334.9 |
| U.S. Average: | 228.2 |
Violent crime rate in 2019
| Sioux Falls: | 276.1 |
| U.S. Average: | 219.9 |
Violent crime rate in 2018
| Sioux Falls: | 256.2 |
| U.S. Average: | 221.2 |
Violent crime rate in 2017
| Sioux Falls: | 254.7 |
| U.S. Average: | 226.2 |
Violent crime rate in 2016
| Sioux Falls: | 301.7 |
| U.S. Average: | 227.3 |
Violent crime rate in 2015
| Sioux Falls: | 281.5 |
| U.S. Average: | 219.3 |
Violent crime rate in 2014
| Sioux Falls: | 271.3 |
| U.S. Average: | 211.1 |
Violent crime rate in 2013
| Sioux Falls: | 247.0 |
| U.S. Average: | 214.2 |
Violent crime rate in 2012
| Sioux Falls: | 250.4 |
| U.S. Average: | 187.4 |
Violent crime rate in 2011
| Sioux Falls: | 183.3 |
| U.S. Average: | 187.1 |
Violent crime rate in 2010
| Sioux Falls: | 195.6 |
| U.S. Average: | 195.7 |
Violent crime rate in 2009
| Sioux Falls: | 186.9 |
| U.S. Average: | 208.9 |
Violent crime rate in 2008
| Sioux Falls: | 220.5 |
| U.S. Average: | 222.5 |
Violent crime rate in 2007
| Sioux Falls: | 149.1 |
| U.S. Average: | 229.1 |
Violent crime rate in 2006
| Sioux Falls: | 186.2 |
| U.S. Average: | 232.6 |
Violent crime rate in 2005
| Sioux Falls: | 200.4 |
| U.S. Average: | 227.0 |
Property crime rate in 2022
| Sioux Falls: | 263.5 |
| U.S. Average: | 166.5 |
Property crime rate in 2021
| Sioux Falls: | 241.1 |
| U.S. Average: | 157.8 |
Property crime rate in 2020
| Sioux Falls: | 260.6 |
| U.S. Average: | 169.6 |
Property crime rate in 2019
| Sioux Falls: | 243.9 |
| U.S. Average: | 179.7 |
Property crime rate in 2018
| Sioux Falls: | 231.0 |
| U.S. Average: | 190.2 |
Property crime rate in 2017
| Sioux Falls: | 224.4 |
| U.S. Average: | 206.4 |
Property crime rate in 2016
| Sioux Falls: | 269.4 |
| U.S. Average: | 216.6 |
Property crime rate in 2015
| Sioux Falls: | 285.1 |
| U.S. Average: | 221.5 |
Property crime rate in 2014
| Sioux Falls: | 242.7 |
| U.S. Average: | 230.8 |
Property crime rate in 2013
| Sioux Falls: | 250.6 |
| U.S. Average: | 250.4 |
Property crime rate in 2012
| Sioux Falls: | 265.9 |
| U.S. Average: | 267.3 |
Property crime rate in 2011
| Sioux Falls: | 254.9 |
| U.S. Average: | 273.5 |
Property crime rate in 2010
| Sioux Falls: | 270.4 |
| U.S. Average: | 276.4 |
Property crime rate in 2009
| Sioux Falls: | 234.6 |
| U.S. Average: | 285.6 |
Property crime rate in 2008
| Sioux Falls: | 208.0 |
| U.S. Average: | 302.2 |
Property crime rate in 2007
| Sioux Falls: | 190.7 |
| U.S. Average: | 309.2 |
Property crime rate in 2006
| Sioux Falls: | 203.1 |
| U.S. Average: | 317.3 |
Property crime rate in 2005
| Sioux Falls: | 221.7 |
| U.S. Average: | 322.3 |


Full-time law enforcement employees in 2021, including police officers: 306 (271 officers - 237 male; 34 female).
| Officers per 1,000 residents here: | 1.42 |
| South Dakota average: | 2.20 |
Full-time law enforcement employees in 2020, including police officers: 308 (273 officers - 241 male; 32 female).
| Officers per 1,000 residents here: | 1.46 |
| South Dakota average: | 2.08 |
Full-time law enforcement employees in 2019, including police officers: 290 (255 officers - 226 male; 29 female).
| Officers per 1,000 residents here: | 1.37 |
| South Dakota average: | 2.02 |
Full-time law enforcement employees in 2018, including police officers: 293 (256 officers - 231 male; 25 female).
| Officers per 1,000 residents here: | 1.42 |
| South Dakota average: | 2.05 |
Full-time law enforcement employees in 2017, including police officers: 293 (258 officers - 232 male; 26 female).
| Officers per 1,000 residents here: | 1.45 |
| South Dakota average: | 2.07 |
Full-time law enforcement employees in 2016, including police officers: 276 (239 officers - 217 male; 22 female).
| Officers per 1,000 residents here: | 1.36 |
| South Dakota average: | 2.01 |
Full-time law enforcement employees in 2015, including police officers: 268 (234 officers - 213 male; 21 female).
| Officers per 1,000 residents here: | 1.36 |
| South Dakota average: | 2.01 |
Full-time law enforcement employees in 2014, including police officers: 277 (244 officers - 224 male; 20 female).
| Officers per 1,000 residents here: | 1.46 |
| South Dakota average: | 1.96 |
Full-time law enforcement employees in 2013, including police officers: 279 (245 officers - 223 male; 22 female).
| Officers per 1,000 residents here: | 1.51 |
| South Dakota average: | 1.82 |
Full-time law enforcement employees in 2012, including police officers: 264 (229 officers - 209 male; 20 female).
| Officers per 1,000 residents here: | 1.45 |
| South Dakota average: | 1.93 |
Full-time law enforcement employees in 2011, including police officers: 265 (230 officers - 213 male; 17 female).
| Officers per 1,000 residents here: | 1.48 |
| South Dakota average: | 1.88 |
Full-time law enforcement employees in 2010, including police officers: 261 (223 officers - 207 male; 16 female).
| Officers per 1,000 residents here: | 1.45 |
| South Dakota average: | 1.86 |
Full-time law enforcement employees in 2009, including police officers: 259 (219 officers - 202 male; 17 female).
| Officers per 1,000 residents here: | 1.38 |
| South Dakota average: | 1.83 |
Full-time law enforcement employees in 2008, including police officers: 255 (217 officers - 203 male; 14 female).
| Officers per 1,000 residents here: | 1.40 |
| South Dakota average: | 1.79 |
Full-time law enforcement employees in 2007, including police officers: 253 (216 officers - 198 male; 18 female).
| Officers per 1,000 residents here: | 1.49 |
| South Dakota average: | 1.79 |
Full-time law enforcement employees in 2006, including police officers: 252 (216 officers - 198 male; 18 female).
| Officers per 1,000 residents here: | 1.54 |
| South Dakota average: | 1.59 |
Full-time law enforcement employees in 2005, including police officers: 237 (205 officers - 188 male; 17 female).
| Officers per 1,000 residents here: | 1.49 |
| South Dakota average: | 1.80 |
Full-time law enforcement employees in 2004, including police officers: 236 (203 officers - 186 male; 17 female).
| Officers per 1,000 residents here: | 1.50 |
| South Dakota average: | 1.79 |
Full-time law enforcement employees in 2003, including police officers: 233 (205 officers - 190 male; 15 female).
| Officers per 1,000 residents here: | 1.56 |
| South Dakota average: | 1.71 |


