Crime rate in Rockford, Illinois (IL): murders, rapes, robberies, assaults, burglaries, thefts, auto thefts, arson, law enforcement employees, police officers, crime map
Crime rate in Rockford, IL
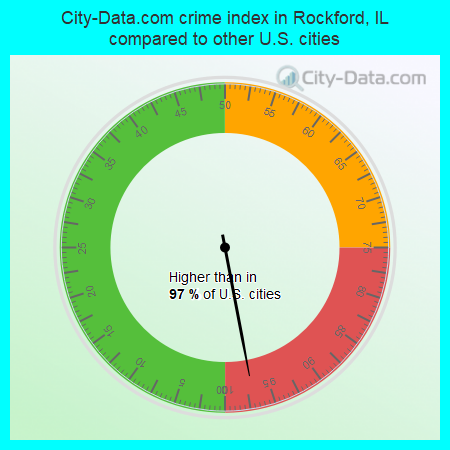
The 2022 crime rate in Rockford, IL is 511 (City-Data.com crime index), which is 2.1 times greater than the U.S. average. It was higher than in 97.0% U.S. cities. The 2022 Rockford crime rate fell by 5% compared to 2021. The number of homicides stood at 16 - a decrease of 3 compared to 2021. In the last 5 years Rockford has seen increasing violent crime and decline of property crime.See how dangerous Rockford, IL is compared to the nearest cities:
(Note: Higher means more crime)
(Note: Higher means more crime)
| Rockford: | 511.0 |
| Loves Park: | 211.3 |
| Cherry Valley: | 376.7 |
| Machesney Park: | 133.1 |
| Winnebago: | 71.1 |
| Roscoe: | 64.6 |
| Belvidere: | 35.3 |
| Rockton: | 73.7 |
| Byron: | 39.7 |
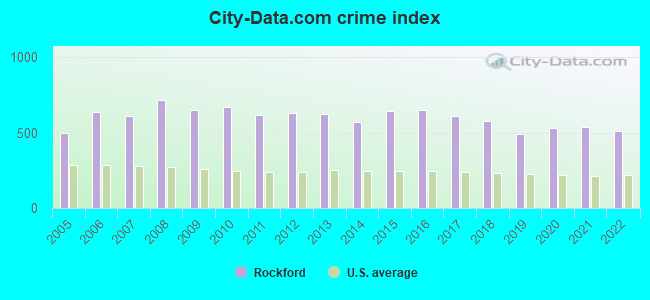
The City-Data.com crime index weighs serious crimes and violent crimes more heavily. Higher means more crime, U.S. average is 246.1. It adjusts for the number of visitors and daily workers commuting into cities.
- means the value is about the same as the state average.- means the value is bigger than the state average.
- means the value is much bigger than the state average.
According to our research of Illinois and other state lists, there were 588 registered sex offenders living in Rockford, Illinois as of May 26, 2024.
The ratio of all residents to sex offenders in Rockford is 251 to 1.
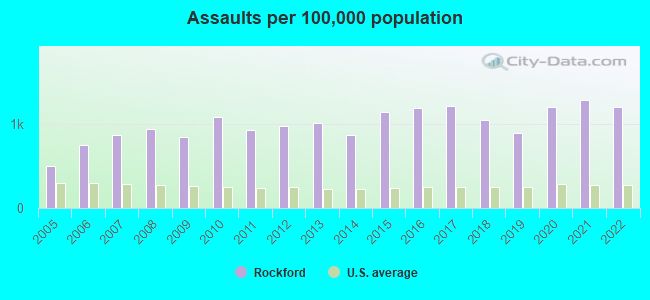
Violent crime rate in 2022
| Rockford: | 775.0 |
| U.S. Average: | 219.8 |
Violent crime rate in 2021
| Rockford: | 840.5 |
| U.S. Average: | 224.8 |
Violent crime rate in 2020
| Rockford: | 797.3 |
| U.S. Average: | 228.2 |
Violent crime rate in 2019
| Rockford: | 648.2 |
| U.S. Average: | 219.9 |
Violent crime rate in 2018
| Rockford: | 772.6 |
| U.S. Average: | 221.2 |
Violent crime rate in 2017
| Rockford: | 857.8 |
| U.S. Average: | 226.2 |
Violent crime rate in 2016
| Rockford: | 905.2 |
| U.S. Average: | 227.3 |
Violent crime rate in 2015
| Rockford: | 870.6 |
| U.S. Average: | 219.3 |
Violent crime rate in 2014
| Rockford: | 685.6 |
| U.S. Average: | 211.1 |
Violent crime rate in 2013
| Rockford: | 758.9 |
| U.S. Average: | 214.2 |
Violent crime rate in 2012
| Rockford: | 752.2 |
| U.S. Average: | 187.4 |
Violent crime rate in 2011
| Rockford: | 746.1 |
| U.S. Average: | 187.1 |
Violent crime rate in 2010
| Rockford: | 807.2 |
| U.S. Average: | 195.7 |
Violent crime rate in 2009
| Rockford: | 715.4 |
| U.S. Average: | 208.9 |
Violent crime rate in 2008
| Rockford: | 764.0 |
| U.S. Average: | 222.5 |
Violent crime rate in 2007
| Rockford: | 648.2 |
| U.S. Average: | 229.1 |
Violent crime rate in 2006
| Rockford: | 584.2 |
| U.S. Average: | 232.6 |
Violent crime rate in 2005
| Rockford: | 393.8 |
| U.S. Average: | 227.0 |
Property crime rate in 2022
| Rockford: | 248.2 |
| U.S. Average: | 166.5 |
Property crime rate in 2021
| Rockford: | 226.9 |
| U.S. Average: | 157.8 |
Property crime rate in 2020
| Rockford: | 247.0 |
| U.S. Average: | 169.6 |
Property crime rate in 2019
| Rockford: | 298.1 |
| U.S. Average: | 179.7 |
Property crime rate in 2018
| Rockford: | 337.7 |
| U.S. Average: | 190.2 |
Property crime rate in 2017
| Rockford: | 355.0 |
| U.S. Average: | 206.4 |
Property crime rate in 2016
| Rockford: | 364.3 |
| U.S. Average: | 216.6 |
Property crime rate in 2015
| Rockford: | 379.3 |
| U.S. Average: | 221.5 |
Property crime rate in 2014
| Rockford: | 412.5 |
| U.S. Average: | 230.8 |
Property crime rate in 2013
| Rockford: | 461.9 |
| U.S. Average: | 250.4 |
Property crime rate in 2012
| Rockford: | 497.0 |
| U.S. Average: | 267.3 |
Property crime rate in 2011
| Rockford: | 450.5 |
| U.S. Average: | 273.5 |
Property crime rate in 2010
| Rockford: | 518.4 |
| U.S. Average: | 276.4 |
Property crime rate in 2009
| Rockford: | 535.3 |
| U.S. Average: | 285.6 |
Property crime rate in 2008
| Rockford: | 636.7 |
| U.S. Average: | 302.2 |
Property crime rate in 2007
| Rockford: | 528.0 |
| U.S. Average: | 309.2 |
Property crime rate in 2006
| Rockford: | 621.8 |
| U.S. Average: | 317.3 |
Property crime rate in 2005
| Rockford: | 548.3 |
| U.S. Average: | 322.3 |


Full-time law enforcement employees in 2021, including police officers: 325 (282 officers - 245 male; 37 female).
| Officers per 1,000 residents here: | 1.96 |
| Illinois average: | 2.84 |
Full-time law enforcement employees in 2020, including police officers: 332 (289 officers - 255 male; 34 female).
| Officers per 1,000 residents here: | 2.00 |
| Illinois average: | 3.04 |
Full-time law enforcement employees in 2019, including police officers: 338 (298 officers - 264 male; 34 female).
| Officers per 1,000 residents here: | 2.05 |
| Illinois average: | 3.06 |
Full-time law enforcement employees in 2018, including police officers: 339 (299 officers - 266 male; 33 female).
| Officers per 1,000 residents here: | 2.05 |
| Illinois average: | 3.21 |
Full-time law enforcement employees in 2017, including police officers: 323 (284 officers - 251 male; 33 female).
| Officers per 1,000 residents here: | 1.94 |
| Illinois average: | 3.15 |
Full-time law enforcement employees in 2016, including police officers: 323 (288 officers - 255 male; 33 female).
| Officers per 1,000 residents here: | 1.95 |
| Illinois average: | 3.16 |
Full-time law enforcement employees in 2015, including police officers: 315 (280 officers - 245 male; 35 female).
| Officers per 1,000 residents here: | 1.89 |
| Illinois average: | 2.42 |
Full-time law enforcement employees in 2014, including police officers: 314 (280 officers - 244 male; 36 female).
| Officers per 1,000 residents here: | 1.87 |
| Illinois average: | 3.28 |
Full-time law enforcement employees in 2012, including police officers: 301 (271 officers - 237 male; 34 female).
| Officers per 1,000 residents here: | 1.78 |
| Illinois average: | 2.76 |
Full-time law enforcement employees in 2011, including police officers: 294 (264 officers - 228 male; 36 female).
| Officers per 1,000 residents here: | 1.72 |
| Illinois average: | 2.78 |
Full-time law enforcement employees in 2010, including police officers: 307 (277 officers - 238 male; 39 female).
| Officers per 1,000 residents here: | 1.81 |
| Illinois average: | 2.78 |
Full-time law enforcement employees in 2009, including police officers: 315 (284 officers - 245 male; 39 female).
| Officers per 1,000 residents here: | 1.80 |
| Illinois average: | 2.86 |
Full-time law enforcement employees in 2008, including police officers: 335 (302 officers - 261 male; 41 female).
| Officers per 1,000 residents here: | 1.92 |
| Illinois average: | 2.91 |
Full-time law enforcement employees in 2007, including police officers: 335 (304 officers - 261 male; 43 female).
| Officers per 1,000 residents here: | 1.95 |
| Illinois average: | 2.92 |
Full-time law enforcement employees in 2006, including police officers: 336 (304 officers - 260 male; 44 female).
| Officers per 1,000 residents here: | 1.98 |
| Illinois average: | 2.92 |
Full-time law enforcement employees in 2005, including police officers: 332 (301 officers - 258 male; 43 female).
| Officers per 1,000 residents here: | 1.97 |
| Illinois average: | 2.87 |
Full-time law enforcement employees in 2004, including police officers: 325 (293 officers - 253 male; 40 female).
| Officers per 1,000 residents here: | 1.92 |
| Illinois average: | 2.88 |
Full-time law enforcement employees in 2003, including police officers: 327 (293 officers - 252 male; 41 female).
| Officers per 1,000 residents here: | 1.93 |
| Illinois average: | 2.90 |


