Crime rate in Providence, Rhode Island (RI): murders, rapes, robberies, assaults, burglaries, thefts, auto thefts, arson, law enforcement employees, police officers, crime map
Crime rate in Providence, RI
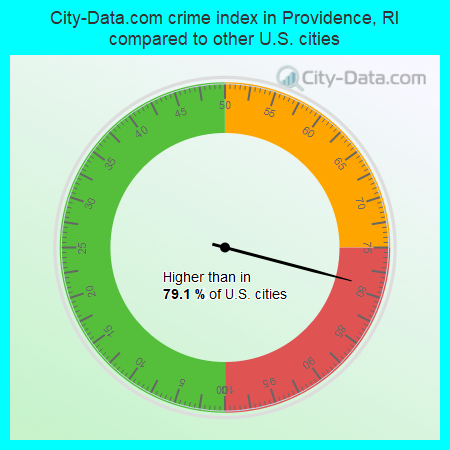
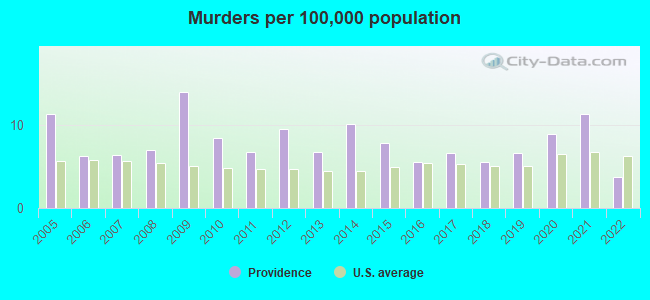
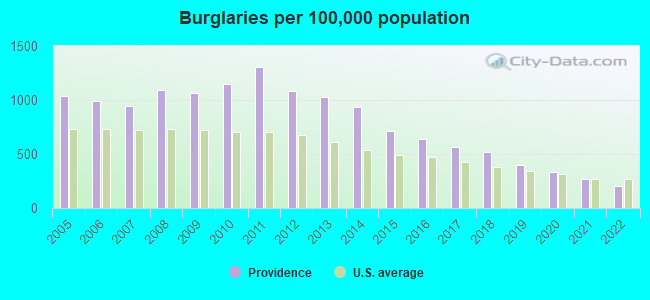
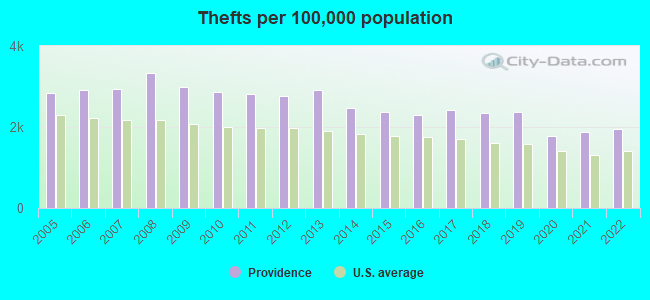
The 2022 crime rate in Providence, RI is 225 (City-Data.com crime index), which is about the average for the U.S. cities. It was higher than in 79.1% U.S. cities. The 2022 Providence crime rate fell by 13% compared to 2021. The number of homicides stood at 7 - a decrease of 14 compared to 2021. In the last 5 years Providence has seen decline of violent crime and decline of property crime.See how dangerous Providence, RI is compared to the nearest cities:
(Note: Higher means more crime)
(Note: Higher means more crime)
| Providence: | 225.0 |
| North Providence: | 86.1 |
| East Providence: | 67.7 |
| Johnston: | 97.3 |
| Cranston: | 101.3 |
| Pawtucket: | 206.7 |
| Central Falls: | 185.2 |
| Seekonk: | 151.4 |
| Lincoln: | 102.5 |
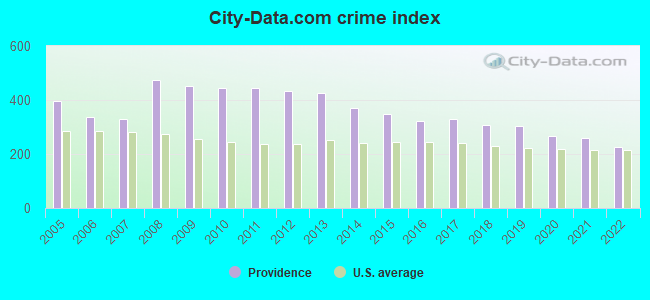
The City-Data.com crime index weighs serious crimes and violent crimes more heavily. Higher means more crime, U.S. average is 246.1. It adjusts for the number of visitors and daily workers commuting into cities.
- means the value is smaller than the state average.- means the value is about the same as the state average.
- means the value is bigger than the state average.
- means the value is much bigger than the state average.
According to our research of Rhode Island and other state lists, there were 302 registered sex offenders living in Providence, Rhode Island as of May 26, 2024.
The ratio of all residents to sex offenders in Providence is 593 to 1.
Violent crime rate in 2022
| Providence: | 192.8 |
| U.S. Average: | 219.8 |
Violent crime rate in 2021
| Providence: | 237.8 |
| U.S. Average: | 224.8 |
Violent crime rate in 2020
| Providence: | 274.2 |
| U.S. Average: | 228.2 |
Violent crime rate in 2019
| Providence: | 289.5 |
| U.S. Average: | 219.9 |
Violent crime rate in 2018
| Providence: | 270.0 |
| U.S. Average: | 221.2 |
Violent crime rate in 2017
| Providence: | 308.0 |
| U.S. Average: | 226.2 |
Violent crime rate in 2016
| Providence: | 329.0 |
| U.S. Average: | 227.3 |
Violent crime rate in 2015
| Providence: | 327.0 |
| U.S. Average: | 219.3 |
Violent crime rate in 2014
| Providence: | 302.3 |
| U.S. Average: | 211.1 |
Violent crime rate in 2013
| Providence: | 353.3 |
| U.S. Average: | 214.2 |
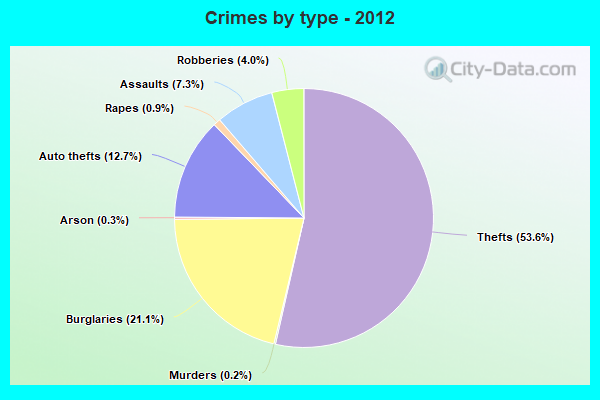
Violent crime rate in 2012
| Providence: | 358.1 |
| U.S. Average: | 187.4 |
Violent crime rate in 2011
| Providence: | 351.7 |
| U.S. Average: | 187.1 |
Violent crime rate in 2010
| Providence: | 375.2 |
| U.S. Average: | 195.7 |
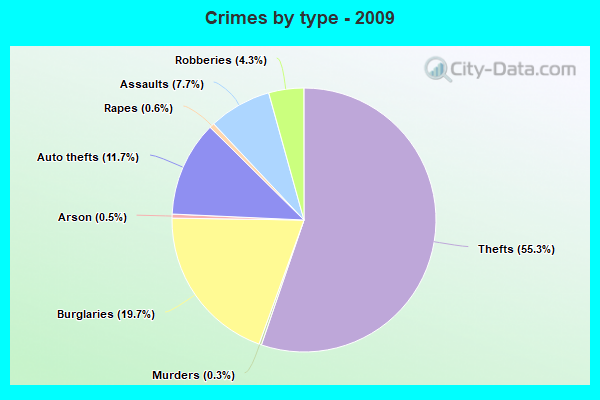
Violent crime rate in 2009
| Providence: | 383.3 |
| U.S. Average: | 208.9 |
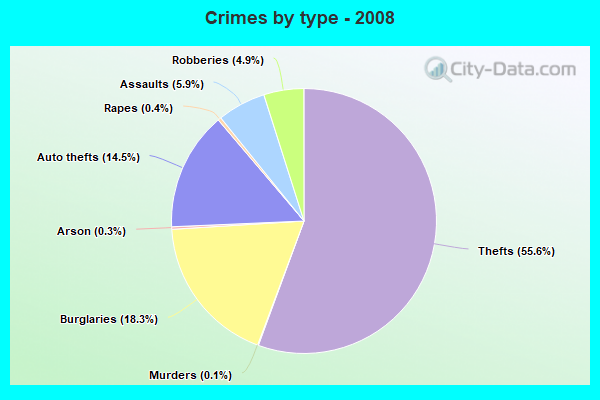
Violent crime rate in 2008
| Providence: | 364.4 |
| U.S. Average: | 222.5 |
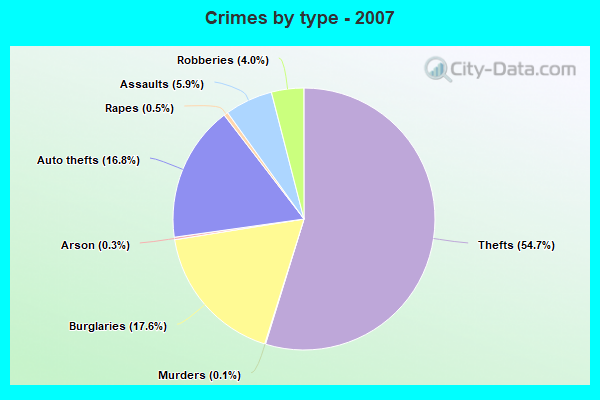
Violent crime rate in 2007
| Providence: | 240.6 |
| U.S. Average: | 229.1 |
Violent crime rate in 2006
| Providence: | 237.8 |
| U.S. Average: | 232.6 |
Violent crime rate in 2005
| Providence: | 305.5 |
| U.S. Average: | 227.0 |
Property crime rate in 2022
| Providence: | 194.9 |
| U.S. Average: | 166.5 |
Property crime rate in 2021
| Providence: | 205.1 |
| U.S. Average: | 157.8 |
Property crime rate in 2020
| Providence: | 202.0 |
| U.S. Average: | 169.6 |
Property crime rate in 2019
| Providence: | 237.3 |
| U.S. Average: | 179.7 |
Property crime rate in 2018
| Providence: | 266.9 |
| U.S. Average: | 190.2 |
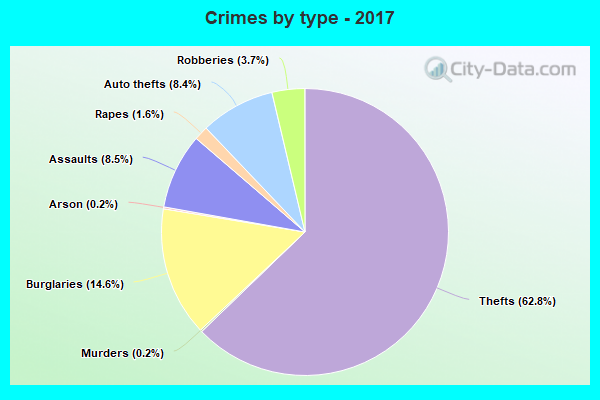
Property crime rate in 2017
| Providence: | 281.8 |
| U.S. Average: | 206.4 |
Property crime rate in 2016
| Providence: | 252.7 |
| U.S. Average: | 216.6 |
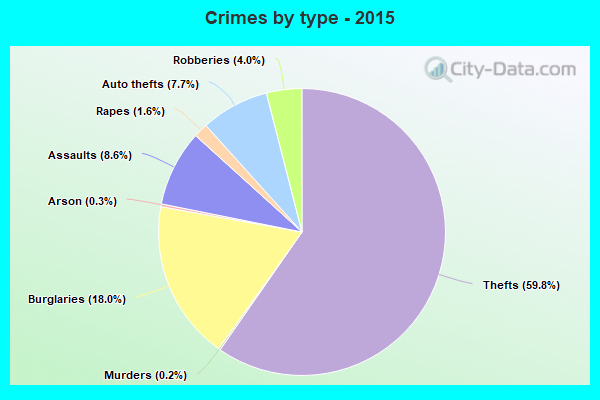
Property crime rate in 2015
| Providence: | 307.2 |
| U.S. Average: | 221.5 |
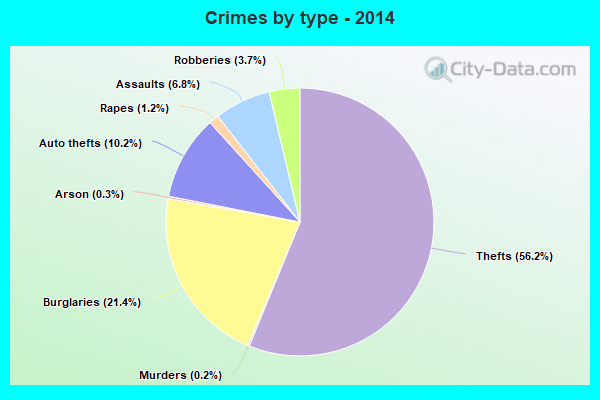
Property crime rate in 2014
| Providence: | 376.9 |
| U.S. Average: | 230.8 |
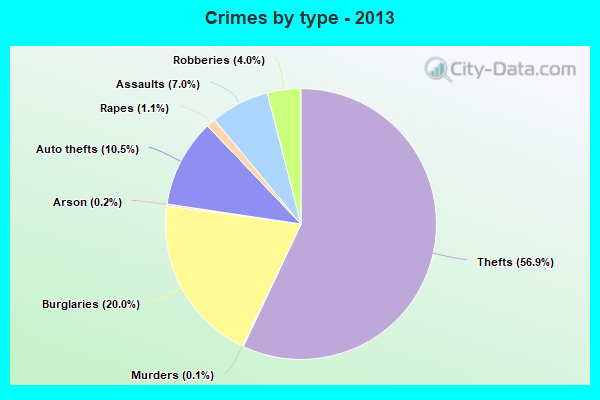
Property crime rate in 2013
| Providence: | 432.3 |
| U.S. Average: | 250.4 |
Property crime rate in 2012
| Providence: | 453.1 |
| U.S. Average: | 267.3 |
Property crime rate in 2011
| Providence: | 495.0 |
| U.S. Average: | 273.5 |
Property crime rate in 2010
| Providence: | 466.2 |
| U.S. Average: | 276.4 |
Property crime rate in 2009
| Providence: | 456.5 |
| U.S. Average: | 285.6 |
Property crime rate in 2008
| Providence: | 516.8 |
| U.S. Average: | 302.2 |
Property crime rate in 2007
| Providence: | 371.0 |
| U.S. Average: | 309.2 |
Property crime rate in 2006
| Providence: | 388.9 |
| U.S. Average: | 317.3 |
Property crime rate in 2005
| Providence: | 426.2 |
| U.S. Average: | 322.3 |


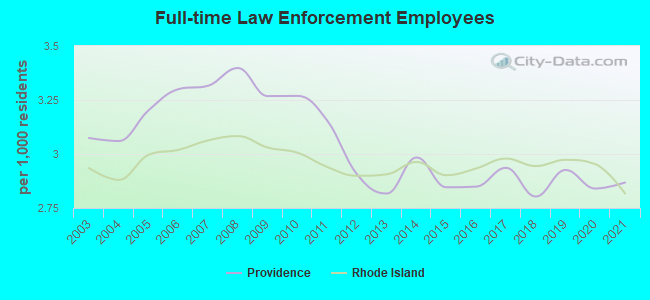
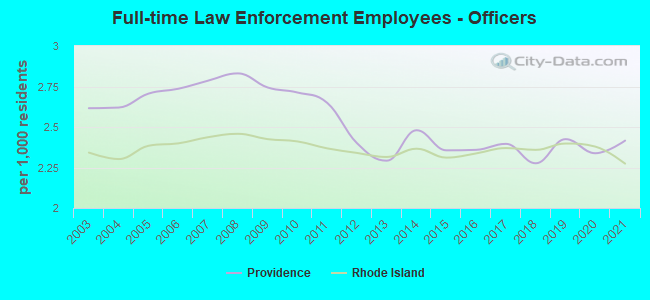
Full-time law enforcement employees in 2021, including police officers: 533 (449 officers - 397 male; 52 female).
| Officers per 1,000 residents here: | 2.42 |
| Rhode Island average: | 2.27 |
Full-time law enforcement employees in 2020, including police officers: 510 (420 officers - 376 male; 44 female).
| Officers per 1,000 residents here: | 2.34 |
| Rhode Island average: | 2.38 |
Full-time law enforcement employees in 2019, including police officers: 526 (436 officers - 392 male; 44 female).
| Officers per 1,000 residents here: | 2.43 |
| Rhode Island average: | 2.40 |
Full-time law enforcement employees in 2018, including police officers: 505 (410 officers - 370 male; 40 female).
| Officers per 1,000 residents here: | 2.28 |
| Rhode Island average: | 2.36 |
Full-time law enforcement employees in 2017, including police officers: 528 (431 officers - 391 male; 40 female).
| Officers per 1,000 residents here: | 2.40 |
| Rhode Island average: | 2.37 |
Full-time law enforcement employees in 2016, including police officers: 511 (423 officers - 390 male; 33 female).
| Officers per 1,000 residents here: | 2.36 |
| Rhode Island average: | 2.34 |
Full-time law enforcement employees in 2015, including police officers: 511 (423 officers - 390 male; 33 female).
| Officers per 1,000 residents here: | 2.36 |
| Rhode Island average: | 2.31 |
Full-time law enforcement employees in 2014, including police officers: 533 (443 officers - 409 male; 34 female).
| Officers per 1,000 residents here: | 2.48 |
| Rhode Island average: | 2.37 |
Full-time law enforcement employees in 2013, including police officers: 504 (410 officers - 382 male; 28 female).
| Officers per 1,000 residents here: | 2.29 |
| Rhode Island average: | 2.31 |
Full-time law enforcement employees in 2012, including police officers: 517 (427 officers - 398 male; 29 female).
| Officers per 1,000 residents here: | 2.40 |
| Rhode Island average: | 2.34 |
Full-time law enforcement employees in 2011, including police officers: 561 (471 officers - 435 male; 36 female).
| Officers per 1,000 residents here: | 2.65 |
| Rhode Island average: | 2.37 |
Full-time law enforcement employees in 2010, including police officers: 582 (483 officers - 449 male; 34 female).
| Officers per 1,000 residents here: | 2.71 |
| Rhode Island average: | 2.41 |
Full-time law enforcement employees in 2009, including police officers: 561 (471 officers - 435 male; 36 female).
| Officers per 1,000 residents here: | 2.74 |
| Rhode Island average: | 2.42 |
Full-time law enforcement employees in 2008, including police officers: 581 (484 officers - 448 male; 36 female).
| Officers per 1,000 residents here: | 2.83 |
| Rhode Island average: | 2.46 |
Full-time law enforcement employees in 2007, including police officers: 576 (484 officers - 450 male; 34 female).
| Officers per 1,000 residents here: | 2.79 |
| Rhode Island average: | 2.44 |
Full-time law enforcement employees in 2006, including police officers: 579 (480 officers - 445 male; 35 female).
| Officers per 1,000 residents here: | 2.74 |
| Rhode Island average: | 2.40 |
Full-time law enforcement employees in 2005, including police officers: 568 (480 officers - 444 male; 36 female).
| Officers per 1,000 residents here: | 2.71 |
| Rhode Island average: | 2.38 |
Full-time law enforcement employees in 2004, including police officers: 542 (464 officers - 430 male; 34 female).
| Officers per 1,000 residents here: | 2.62 |
| Rhode Island average: | 2.30 |
Full-time law enforcement employees in 2003, including police officers: 544 (463 officers - 430 male; 33 female).
| Officers per 1,000 residents here: | 2.62 |
| Rhode Island average: | 2.34 |